 Cardamon
Free
Cardamon
Free
Cardamon is suitable for individuals and teams to quickly verify and implement.
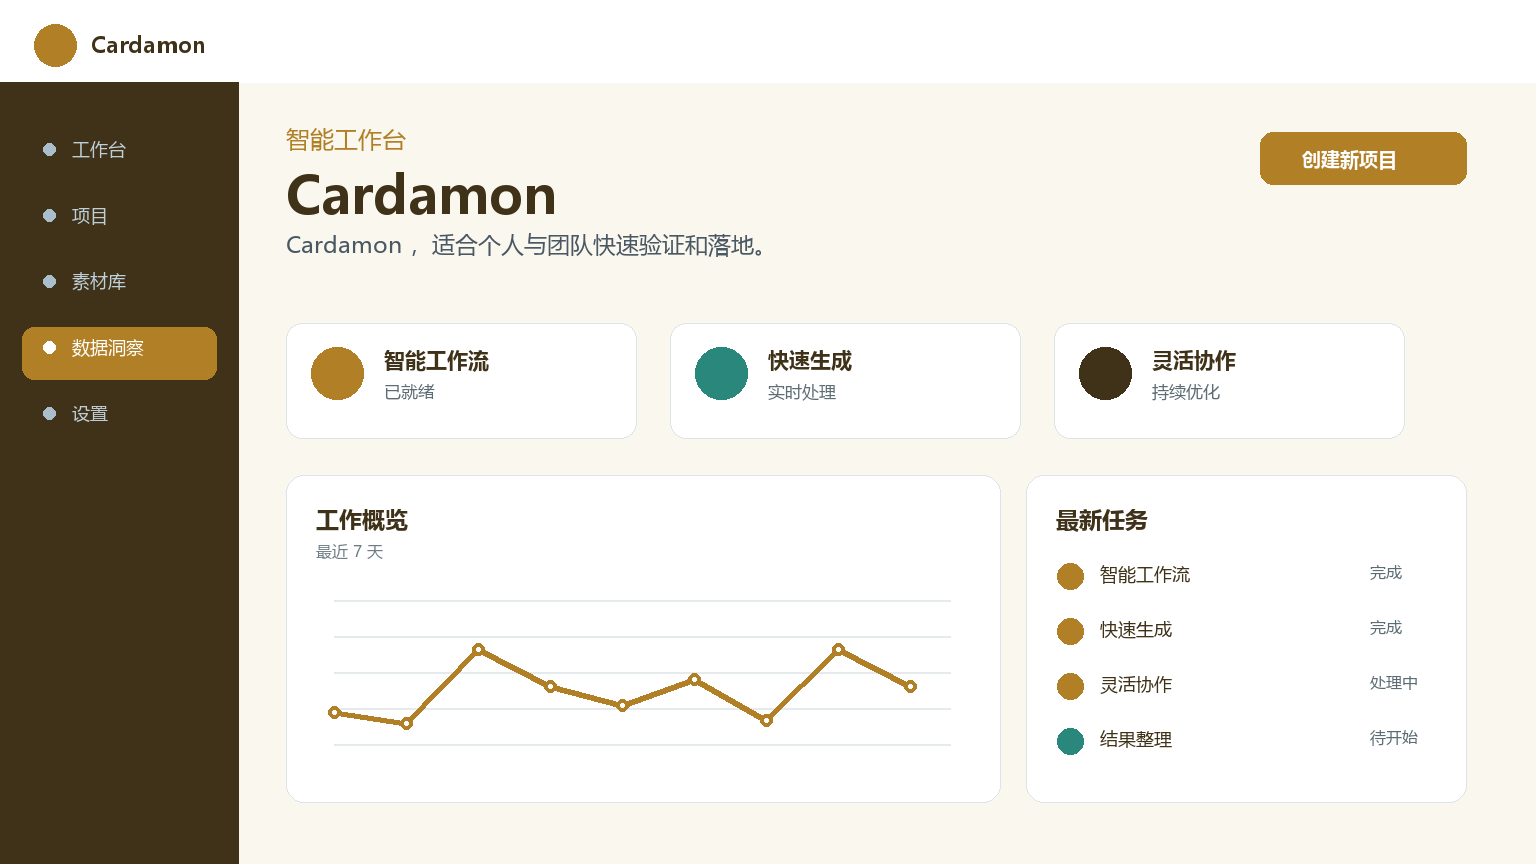
Cardamon
Core parameters and statistics
Cardamon focuses on the direction of "using natural language to drive data analysis" and aims to lower the threshold for conversion from raw data to insight reports. In the traditional data analysis process, users need to master SQL, Python or at least be familiar with the operation logic of BI tools (such as Tableau, Power BI) to complete the complete link from data query to visualization. Cardamon attempts to use AI to replace intermediate technical links: users describe analysis needs in everyday language, the system automatically completes data query, statistical calculation and chart generation, and outputs analysis reports that can be directly used for decision-making reference.
| Project | Specifications |
|---|---|
| Product Name | Cardamon |
| Category | ai-agents |
| Delivery form | Web/SaaS |
| Support Platform | Web |
| Supported languages | zh-CN, en-US |
| Target users | Data analysts, operators, managers |
| User scale | Undisclosed |
| Pricing Model | Freemium / Subscription |
Core capability indicators: Supported data source types include MySQL, PostgreSQL, Snowflake, BigQuery, CSV/Excel, and Google Sheets. Chart types include line charts, column charts, pie charts, scatter charts, heat maps, Sankey charts, etc. 20+ types. Report export formats are PDF, PPT, and HTML online links. A single table can have up to 2 million rows (standard version). Product Concept: Emphasis on "dialogueability of analysis" - users do not need to describe all their needs at once, but gradually refine the analysis direction through multiple rounds of dialogue. For example, first ask "last month's sales trend" and then add "split it by product line". AI can understand the context of the conversation and continue to deepen the existing analysis results. This interaction model is closer to the way of collaboration between human analysts, transforming data analysis from "you need to be able to write SQL" for amateur users to "you can check it if you can speak human language".
User and market recognition
Cardamon has not yet disclosed verifiable data such as user numbers or corporate cooperation cases. Judging from its product form, it is targeted at individual users and small and medium-sized enterprises that have high requirements for efficiency. Objective judgment should be based on the official real-time page and verifiable user reviews.
Natural language data analysis (NL2SQL + NL2Visualization) is one of the popular directions of AI applications in recent years. Market Size: According to the MarketsAndMarkets 2026 report, the AI-Native BI market has a compound annual growth rate of 28% and is expected to exceed US$5 billion by 2028. There are already multiple competing products on the market that approach from different angles - Tableau's Ask Data (embedded NL query, but with limited functionality), ThoughtSpot (focused on search-based analysis, enterprise-level positioning), and various AI-Native BI startups. The core difference of Cardamon is the combination of "conversational analysis" and "automated report generation", which not only answers users' immediate questions, but also organizes the analysis process into structured report documents. Competitive product differences: Compared with ThoughtSpot (suitable for enterprise-level large-scale deployment, but higher price), Cardamon's individual/team subscription model is more suitable for small and medium-sized teams; compared with Tableau Ask Data (only within the Tableau ecosystem), Cardamon supports more data source types. When evaluating, users are advised to focus on its support for complex queries (multi-table associations, aggregation calculations, time series, window functions) and the format flexibility of report generation. Risk Disclosure: The accuracy of NL2SQL is the core bottleneck of the product - for complex business queries, the accuracy is usually in the 75-90% range, and a query confirmation mechanism needs to be established to avoid misleading analysis results due to SQL errors.
Cost advantage
Cardamon is provided as an online service, and the official website opens a free trial entrance.
| Cost Dimension | Description |
|---|---|
| Free version | Number of basic data sources (1-2) + limited number of queries |
| Personal version | Multiple data sources + advanced charts + report export |
| Team Edition | Collaboration space + shared data sources + scheduled reports |
| Enterprise Edition | Private deployment + row-level permissions + customized models |
Under the traditional model, a business department's data analysis needs usually need to wait in line for support from the data team, and the average cycle from request to response is 2-5 days. Cardamon allows business personnel to complete most common analysis needs (about 70%-80%) by themselves, directly reducing the cost of data analysis collaboration within the organization. Quantitative comparison: Small and medium-sized enterprises can use Cardamon to obtain regular data insight capabilities without a full-time data analyst, and the monthly fee is much lower than the annual salary of a junior data analyst (about 100,000-200,000). Enterprise customers pay on a subscription basis so that the cost is linked to usage, avoiding the upfront investment (usually 100,000+) and maintenance overhead of building a self-built BI platform. Causal chain: The free version verifies the accuracy of NL2SQL → In-depth use of the personal version → The team version shares data sources and report templates → The enterprise version meets data compliance and permissions management. Risk Disclosure: The bottleneck of NL2SQL in the accuracy of complex queries may lead to insufficient trust among business personnel, who ultimately still rely on the data team - it is recommended to conduct accuracy tests on common query types before actual promotion, and to establish a manual confirmation mechanism for query results.
Main functions
- Natural Language Query and Analysis - Users input analysis questions in everyday language, AI automatically parses the intent and maps it to the data model, generates SQL or Python queries, and displays them in charts or tables after execution. Supports questioning (going deeper on the previous basis), comparison (multi-dimensional comparative analysis) and drilling (drilling down from summary to details). Applicable tasks: A typical analysis process can complete data exploration from macro to micro in 3-5 rounds of conversations. For ambiguous queries (such as "this year's sales" refers to the natural year or the fiscal year), the system will proactively ask for confirmation instead of guessing to reduce errors.
- Automated report generation - Automatically organize the analysis process into a structured report document, including analysis overview, key indicators (KPI cards), chart display and preliminary conclusions. Reports can be exported to PDF, PPT or generate links for online sharing. The narrative structure of the report is automatically arranged by AI - first summarizing conclusions, then displaying supporting data, and finally giving recommendations, which is consistent with the reading habits of professional analysis reports. Use value: An analysis no longer ends with "seeing the chart", but with "getting a deliverable report", reducing the additional work between analysis and reporting.
- Intelligent Insight Recommendation - The system automatically scans data characteristics after data access, identifies abnormal fluctuations (such as a sudden 30% drop in traffic on a certain day), trend changes (continuous growth/downward trends) and distribution characteristics (long tail distribution, 80/20 rule), and proactively pushes insights points that may be worthy of attention to users. Advanced capabilities: Supports setting periodic reporting tasks. The system automatically runs analysis and generates reports according to the set time, and pushes them to designated recipients through email or collaboration platforms, realizing the transformation from "people looking for data" to "data looking for people".
Model and version evolution
| Version | Date | Key Changes |
|---|---|---|
| v1.0 (latest version) | Recent | Report generation + Insight recommendation + Scheduled push |
| v0.9 | Early stage | Result visualization + multiple data source access |
| v0.x | Early | Natural language to SQL conversion |
The product development logic follows the path of "can check → can see → can tell". The current version (v1.0) is in the "can speak" stage - a closed loop from data to deliverable reports. Future planning directions include: proactive alarm interpretation of abnormal events, direct hypothesis testing analysis through natural language, and automatic generation of periodic reports based on data calendars. Technical inference: Cardamon's core NL2SQL engine may be based on the CodeGen series model or a specially fine-tuned SQL generation model. The ability to process complex queries (multi-table JOIN, subquery, window function) is a key indicator to distinguish the maturity of the product. Risk Disclosure: The accuracy ceiling of NL2SQL technology is about 85-90% (the best model accuracy on benchmark data sets such as Spider is about 87%), which means that about 10-15% of queries may have errors - especially when the business data model is unfamiliar (such as ambiguous table names, non-standard field names), the error rate may be higher.
Technical advantages
- Core technology route - precise mapping of natural language to queries: The core NLP engine accurately translates complex business descriptions into database query statements, and supports common analysis modes such as multi-table associations (JOIN), aggregate functions (SUM/AVG/COUNT), time windows (year-on-year/month-on-month/MTD/YTD) and conditional filtering (WHERE/HAVING). Interactive analysis context maintenance: The analysis context is maintained in multiple rounds of dialogue. Subsequent questions automatically refer to the previous query results and analysis scope, without the need to repeatedly describe the background conditions - for example, "Look at sales by region" → "Add profit margin" → "Look at East China only", gradually narrowing the scope in three steps.
- Engineering capability: The automated report orchestration engine organizes multiple analysis steps and charts into a logically coherent narrative structure—overview first, then details, first core, then comparison. Intelligent caching: Automatically caches results for repeated queries to reduce database load; cost estimates are made before executing complex queries, and users are prompted for confirmation when the threshold is exceeded. Data security: Supports data set-level permission control and row-level security filters (automatically restricts the visible range of data based on user attributes).
- Security and Compliance: The row-level permission scheme ensures that users can only query data within their authorization scope. It is suitable for enterprise scenarios where multiple departments share the same analysis platform. The privatized deployment solution can deploy the data and analysis engine in the customer's own environment to meet the compliance requirements of finance, medical and other industries. Risk Disclosure: In the SaaS multi-tenant model, it is necessary to confirm whether the data isolation solution (logical isolation vs physical isolation) meets the enterprise's data security requirements.
How to use
| Entrance | How to use |
|---|---|
| Web side | Visit the official website with a browser → Register → Add data source → Ask questions in natural language → The system automatically analyzes and visualizes → Save/Export report |
| API | Submit analytical queries via REST API and get structured results |
Typical usage process: Log in to Cardamon → Add a data source (database connection or upload file) → The system automatically scans the data structure and field meaning → Enter an analysis question in the dialog window (such as "Customer acquisition cost trend of each channel in the past three months") → AI generates queries and charts → If you need in-depth questioning ("Split it by city") → Save the analysis results to a report → Export or share. Best Practice: It is recommended to clean and standardize the field naming in the data source before first use - clear field names (such as "order_amount" instead of "fld_001") can significantly improve the accuracy of AI understanding of query intentions. For complex analysis needs, build gradually through step-by-step questions instead of describing all conditions at once. In team scenarios, it is recommended to establish a shared data dictionary and enter business terms (such as "active users" defined as "users with login records in the past 30 days") into the system to assist AI in understanding the business context.
Product Pricing
| Package | Price | Contents |
|---|---|---|
| Free version | $0 | Number of basic data sources (1-2) + limited number of queries |
| Personal version | — | Multiple data sources + advanced charts + report export |
| Team Edition | — | Collaboration space + shared data sources + scheduled reports |
| Enterprise Edition | — | Private deployment + row-level permissions + custom models |
Pricing. Decision-making suggestions: New users start with the most frequent daily analysis needs and use the free plan to verify the product's performance on actual business data. It is recommended to input 20-30 typical analysis problems encountered in the past month into Cardamon one by one to verify the accuracy of AI's understanding of business-specific queries and the performance of processing data magnitude (response time, query success rate). Make sure that the NL2SQL accuracy rate reaches the standard before choosing a paid plan.
Application scenarios
- Scenario 1: Operation data analysis - The operation team queries daily/weekly core indicators through natural language: DAU/MAU trend, next day/7th/30th day retention, registration → activation → payment conversion rate. Input link: connect to data source → input analysis question → AI executes query → return chart → manual interpretation. Efficiency comparison: It takes an average of 10-30 seconds from asking a question to getting a chart, which is much lower than the 3-5 minutes of manual operation of BI tools. Verification method: Select 10 analysis scenarios in the past week, operate them with Cardamon and traditional BI tools respectively, and compare the time consumption and result accuracy.
- Scenario 2: Marketing effect attribution - After accessing multi-channel marketing data, analyze the ROI, customer acquisition cost (CAC) and conversion path of each channel. Typical question: "Compare the ROAS of each channel last month to see which three channels performed best." Risk Disclosure: Attribution analysis involves multi-table association and data consistency checking - if the data calibers of the CRM and the advertising platform are inconsistent (such as different attribution windows), AI may not be able to automatically identify these differences, and the consistency between data sources needs to be manually confirmed before analysis.
- Scenario 3: Automation of management reports - Convert the data analysis that needs to be reported regularly from manual operations to automated processes. After setting up scheduled tasks, managers receive the last week's operation report generated by the system every Monday morning, including changes in key indicators, anomalies and preliminary analysis conclusions. Verification method: After the automated report runs for 2-4 weeks, manually review the accuracy of the key data in the report (randomly check 5-8 data points), and gradually expand the scope of trust after confirmation. Causal chain: Data source access → AI automatic scanning → Insight recommendation trigger → Manual value confirmation → Set up scheduled reports → Gradually reduce manual review → Form data-driven decision-making habits.
Applicable people
- Individual users: Business operations and analysts, reduce the learning cost of SQL/BI tools through natural language interaction. Middle managers can obtain analysis results on their own without relying on data teams. Independent business analysts can improve analysis efficiency from "hours" to "minutes".
- SME Team: In the absence of a dedicated data team, use Cardamon to quickly obtain key business data insights to assist in business decision-making. The monthly fee is well below the salary of a junior data analyst.
- Large Enterprises: Employees in non-technical departments (marketing, sales, human resources) complete daily data needs by themselves through conversational analysis, reducing cross-department communication costs. The enterprise version's row-level permissions and security auditing meet large-scale deployment requirements.
- Unfit Boundary: Complex statistical modeling (regression analysis, cluster analysis), strict A/B testing causal inference, analysis scenarios that need to comply with data audit standards - AI analysis results should be used as a reference rather than the sole basis for decision-making. AI is most efficient in data exploration and regular report generation, but professional tools (R, SPSS) are still needed for hypothesis testing and complex modeling.
Comparison of competing products
| Comparing Dimensions | Cardamon | Tableau Ask Data | ThoughtSpot | Traditional BI (manual) |
|---|---|---|---|---|
| Core Differences | Conversational Analysis + Automated Reporting | Tableau Embedded NL Queries | Search-based Analysis | Flexible but Inefficient |
| Price | — | Included with Tableau license | Starting at $1,500+/month | Labor cost-based |
| Covered scenarios | Multi-data source NL analysis | Tableau data sources only | Enterprise-level BI | Full scenarios |
| User reviews | Pending verification | G2 4.4/5 | G2 4.3/5 | N/A |
| Technical threshold | Low (conversational) | Medium (requires Tableau basics) | Medium (requires data modeling) | High (requires SQL/BI skills) |
Summary and Outlook
It provides competitive solutions in its field, and its core value lies in lowering the threshold for AI use in this field.
Current limitations: Some advanced features require paid subscription, and the free version has function or usage restrictions; specific technical details and performance benchmarks have not yet been fully disclosed.
Related tools:  CrewAI,
  LangChain
Version Info
- Public beta version :It is currently a publicly accessible version, and specific functions will be updated at a specific pace.
- earlier version :An early trial version, the core direction is consistent with the current version.
User Reviews