 ChartGen AI
Free
ChartGen AI
Free
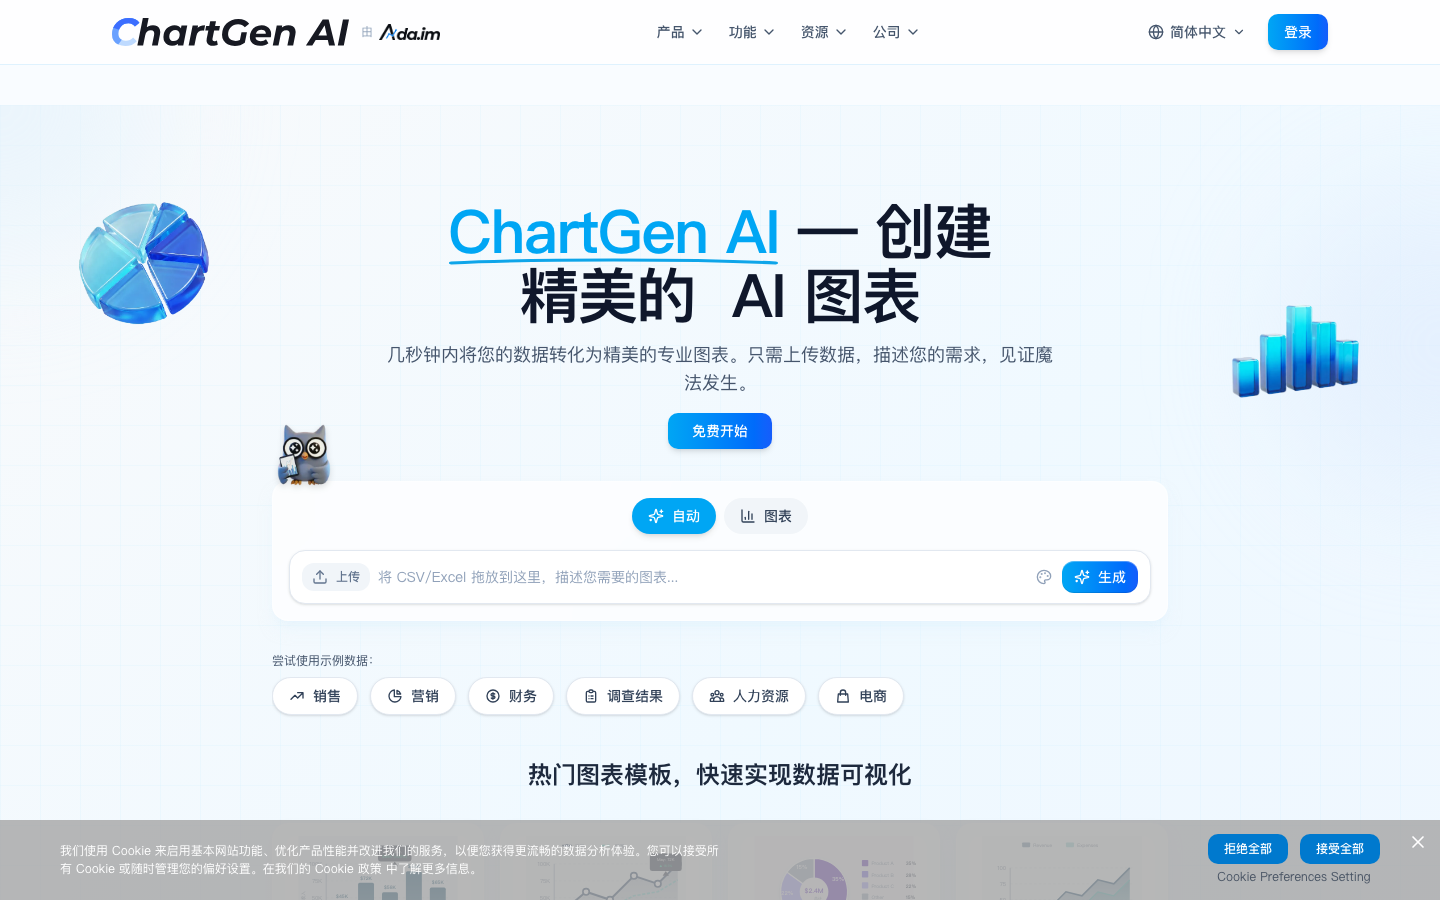
ChartGen AI is an AI chart generation tool. Users only need to upload CSV/Excel data and describe their requirements in natural language to get beautiful, professional charts in seconds, eliminating the tedious process of manually configuring chart parameters. It is suitable for data reporting and content creation.
ChartGenAI
ChartGenAI
Core parameters and statistics of ChartGen AI
ChartGen AI is an AI chart generation tool built on the Ada.im data intelligence platform. Its core value is that the complete link of "chart type selection → field mapping → style configuration" is driven by natural language. Users only need to upload data and a sentence description to get professional-level charts in seconds. Unlike traditional Tableau, Power BI or Excel charts, ChartGen does not require users to understand the applicable boundaries of different chart types, but leaves the intent interpretation to AI.
| Projects | Public Information |
|---|---|
| Official positioning | AI-powered chart generator (AI-driven chart generator) |
| Platform | Ada.im Data Intelligence Platform |
| Input method | CSV / Excel (.xlsx, .xls) / Paste data directly / External data source connection |
| Chart types | 20+ types (basic charts, advanced charts, financial charts, professional charts, flow charts, etc.) |
| Generation speed | Official website nominal <5 seconds |
| Export format | PNG (free), SVG / PDF (paid) |
| Data security | SOC 2 compliance, end-to-end encryption, real-time processing of uploaded files without retention |
| Running platform | Web browser |
| Billing model | Free tier (50 images/month) + subscription (Starter/Growth/Plus/Pro) |
| User scale | Official website public 50,000+ active users, 1,200+ corporate customers |
| Areas covered | 110+ countries |
| Community Rating | G2 4.8 / SourceForge 4.8 |
The significance of generation speed: The graph output time of <5 seconds means that it is oriented to the "instant visualization" scenario-the user opens the page, drags in the data, says a sentence, and gets the chart. The entire interaction can be completed within a meeting or a writing gap, without switching to another dedicated analysis tool. Compared with traditional BI tools, which usually takes 5-15 minutes from opening the software to completing a chart (including data import, field dragging, and style adjustment), ChartGen's chart output speed is an order of magnitude faster.
Secure by Design: SOC 2 compliance and “real-time processing of files without retention” are two key design choices. The former lowers the threshold for corporate procurement to pass compliance review, and the latter provides an explainable basis for cautious compliance departments at the data privacy level. However, the full scope and audit cycle of the SOC 2 Type II report are not disclosed and companies need to request it from Ada.im during the procurement process.
Product Attribution: ChartGen is a core product capability of the Ada.im platform, not an independent company. This means that its iterative roadmap is deeply coupled with Ada.im's Agent capabilities, report engine PPT generation and other functions. When purchasing, you need to consider the entire platform rather than a single chart module. Ada.im is positioned as a "comprehensive data analysis intelligent agent platform". ChartGen is responsible for the chart generation layer, forming a product matrix with report generation Dashboard and PPT export.
Users and market recognition of ChartGen AI
ChartGen’s market recognition mainly comes from the three verifiable dimensions of user scale, enterprise adoption and third-party ratings, rather than financing or media exposure - the latter is not officially disclosed. Compared with similar tools, its market signal characteristics are that the indicators are public but the source of funds is opaque, making it suitable as a reference for product health rather than the sole basis for decision-making.
User and market data: The homepage of the official website discloses four benchmark figures - 2 million+ AI chart generation, 50,000+ active users, 1,200+ corporate customers, covering 110+ countries. These data are scattered in various blocks on the homepage. Although no third-party audit verification is provided, as a self-reported indicator on the product page, its magnitude can reflect that the product has passed the early verification stage and entered large-scale use. Judging from industry experience, 50,000+ active users is an above-average level for a vertical AI charting tool, indicating that the product has established a stable user base in specific scenarios (financial reporting, marketing analysis).
Third-party rating: G2 and SourceForge dual-platform rating of 4.8/5.0 (embedded on the official website homepage), which is in the higher range in the data visualization tool category. Considering that G2 is an important reference source for enterprise software procurement, this score has practical reference value for B-side decision-making. However, it should be noted that the rating sample size and rating time have not been disclosed. High ratings may come from early active user groups, and long-term stability still needs to be observed.
Industry Coverage: The official website focuses on two scenarios: Finance & Accounting and Marketing & Growth among industry scenarios. Customer cases cover cross-regional portraits from Silicon Valley start-ups to Singapore companies. Combined with the number of 1,200+ enterprise customers, it shows that it has a relatively mature path to implementation in the two fields of financial reporting and marketing analysis. It is worth noting that the official website does not display cases from other industries such as medical care, education, and manufacturing, which may mean that ChartGen’s industry adaptability is still expanding rather than fully covered.
Community Ecology: The official has a community channel in Discord, and product entries appear on the Product Hunt platform (associated with the Ada.im product page), forming basic user feedback. However, compared with open source BI tools (such as Metabase, Superset), ChartGen lacks a public template market or connector contribution community, and functional expansion completely relies on official iterations. This means that users’ individual needs need to be fed back through the official support channel, and the response speed depends on the resource allocation of the Ada.im team.
Cost Advantages of ChartGen AI
ChartGen's cost structure is implemented through Ada.im's credits system, which needs to be evaluated from three levels: C-side, developer and enterprise. Its cost advantage does not lie in the absolute low price, but in the progressive path of "the free tier is sufficiently verified, and the paid tier is upgraded according to the credit point ladder". It is similar to the pricing logic of Power BI (free desktop version + Pro subscription) or Tableau (Creator/Explorer/Viewer tiering), but the credit point model is more flexible.
C-side/Personal User: The free tier provides 50 charts per month, covering all 20+ chart types, exported to PNG format. For personal weekly reports, student assignments, and light data analysis, the free tier is basically enough. The paid tier is graded by credits and is no longer billed by the number of charts, but by the complexity of the task - meaning a complex data merge or multi-page PPT generation will consume more credits than a single chart. Comparison with similar products: Canva’s free tier offers limited chart templates but no watermark export for a fee; ChartGen’s free tier is limited to quantity rather than features (all chart types are available), which is more user-friendly for users who need to try multiple chart types.
Developer/API Access: The Pro plan ($50/month) includes API access and commercial licensing and is the entry level for developer integration. However, the detailed rate limit, TTFB and concurrent load limit of the API have not been officially disclosed. Before batch integration, it needs to pass the Pro plan docking test. The private deployment plan does not appear on the public pricing page. You need to contact the Ada.im business team for confirmation. Comparing the API pricing of similar tools: ChartGen’s Pro plan of $50/month is positioned on the low end, but the cost of API calls in credit mode depends on the complexity of the task, and high-frequency calling scenarios may be more expensive than expected.
Enterprise/Team Procurement: The cost component at the enterprise level is not only subscription fees, but also three hidden expenses that need to be considered:
- Credit planning: The credit limits of different plans (Starter/Growth/Plus/Pro) vary significantly (from 1,000 to 16,000/month). Enterprises need to estimate credit consumption based on the actual chart output frequency to avoid cost inflation caused by pay-as-you-go billing after excess. It is recommended to conduct actual credit consumption measurements with typical workloads for 1-2 weeks before purchasing.
- Data source docking cost: The free/Starter plan only supports 1-2 data sources, and enterprises usually require the 5-20+ data source capabilities of Plus or Pro. The subscription level directly determines the feasibility of cross-system integration. If an enterprise has more than 5 data sources that need access, the Plus plan is the starting point.
- Commercial Authorization Boundary: The Pro plan clearly includes commercial authorization, while Starter/Growth/Plus only states "supports all output types" on the page without clarifying commercial use permissions. Enterprises must confirm the commercial licensing terms in the contract before purchasing to avoid copyright risks when charts are used for external reporting.
| Cost Dimension | Free Tier | Starter | Growth | Plus | Pro |
|---|---|---|---|---|---|
| Monthly fee (after first month discount) | $0 | $5 | $12.5 | $25 | $50 |
| monthly credits | 50 images | 1,000 | 3,000 | 7,000 | 16,000 |
| Data source limit | Single source | 2 | 3 | 5 | 20+ |
| Export without watermark | ✗ | ✓ | ✓ | ✓ | ✓ |
| API Access | ✗ | ✗ | ✗ | ✗ | ✓ |
| Commercial Authorization | Unspecified | Unspecified | Unspecified | Unspecified | ✓ |
| Applicable judgment | Functional experience | Personal lightweight | Personal high frequency | Team daily | Enterprise level |
Main features of ChartGen AI
The function of ChartGen is designed around a complete link "from data access to chart output", which can be divided into five dimensions: data layer, generation layer, customization layer, output layer and integration layer. Among them, there are obvious synergies between functions such as cross-analysis of multiple data sources and real-time synchronized AI-native editing, rather than isolated function points. What is particularly noteworthy is that ChartGen’s “natural language charting + PPT exporting” forms a shortcut from data to presentations, which has a cost-reducing effect on high-frequency reporting scenarios that is far greater than that of a single chart generation.
Data access and preparation
- Multi-format upload: Supports CSV, Excel (.xlsx/.xls), you can also directly paste the data table, automatically detect column types, dates and values. The free tier supports a single file up to 100MB, and the paid tier has an undisclosed upper limit.
- External data source connection: Supports connection to external systems such as Snowflake, AWS, Google Sheets, etc., to achieve real-time data synchronization instead of one-time import. The connector list is subject to the latest official documents.
- Cross-source merger: Plus and above plans support cross-data source comparison and cross-aggregation, which is suitable for enterprise scenarios that need to merge and analyze multi-department data. Merge capabilities include basic table joins and field mapping, but no support for custom SQL or complex ETL.
Natural Language Chart Generation
- Intent to chart mapping: AI parses the user's natural language description and automatically selects the most appropriate chart type, aggregation method and field mapping. For example, if you enter "Compare sales by region by quarter", AI will automatically determine whether a grouped histogram or combo chart should be used, without the user having to manually set the X/Y axis. The accuracy of this capability depends on the clarity of the description. The official recommendation is that “the more specific the description, the more consistent the generation will be with expectations.”
- Automatic identification of data aggregation methods: Supports six aggregation methods: Sum, Average, Count, Min, Max, and Count Distinct. AI automatically selects the optimal aggregation based on data type, and users can manually switch after generation. This is very friendly to business users who are not familiar with aggregate functions, but advanced users may want more fine-grained calculation control (such as weighted average, year-over-year comparison).
Chart type coverage (20+)
- Basic Charts: bar chart (vertical/horizontal), line chart, pie chart, area chart
- Advanced Charts: Scatter chart, heat map, combination chart (column + line), waterfall chart, funnel chart
- Stacked and Range Charts: Stacked Column Chart, Stacked Bar Chart, Histogram
- Financial Chart: OHLC chart K-line chart (Candlestick)
- Professional diagrams: pyramid diagram, rectangular treemap (Treemap), Sankey diagram (Sankey), dashboard diagram (Gauge)
- Flowchart: Gantt chart, mind map, flow chart
Expert’s point of view: The real value of ChartGen is not in “how many kinds of diagrams can be drawn”, but in “users don’t need to understand diagrams”. Its competitive barrier is the one-step capability of "natural language → chart type + field mapping + aggregation method". For marketing, operations, and financial personnel with non-data background, this eliminates all the intermediate decision-making between raw data and finished charts. The current 20+ chart types basically cover the chart types required for daily reporting and analysis, but they lack specific scene charts such as geographic maps (choropleth), bubble charts, and radar charts.
Style customization and beautification
- 12 sets of professional color matching themes: Inspired by the report styles of top consulting companies such as McKinsey, one-click switching, covering dark blue, ocean blue, dark green, amber, coral, rose pink and other colors.
- Custom Color Picker: AI automatically applies user-specified custom colors to charts, maintaining brand consistency.
- UI Editing/AI Native Editing: The free tier only supports AI native editing (modified through natural language), and the paid tier additionally provides a UI visual editing panel, suitable for users who need to fine-tune the legend and label positions. The coexistence of two sets of editing methods means that users can choose between rapid generation and fine adjustment as needed.
Chart output and sharing
- Export formats: PNG (full plan), SVG vector (paid), PDF (paid), embed directly into presentations and reports.
- PPT Export: Paid plans support exporting charts directly to PPT, with page limits ranging from 8 pages (Free) to unlimited (Pro). This function is very valuable for professionals who need to frequently produce reporting materials, as it reduces the manual step of "exporting charts and pasting them into PPT".
- Dashboard publishing: After generation, it can be published to the interactive dashboard with one click, supporting link sharing and social media (X/LinkedIn/Reddit/Facebook) distribution. However, the Dashboard only supports browsing and does not support interactive filtering or drilling on the receiving end.
Real-time synchronization and linkage
- Real-time data synchronization: After connecting to an external data source, the chart will automatically refresh when the data is updated, eliminating the need for manual re-import.
- Schedule Task: Plus and above plans support scheduled refresh and generation, suitable for regular reporting scenarios. The configuration granularity and triggering frequency of scheduled tasks are subject to official documents.
Model and version evolution of ChartGen AI
As a product capability of the Ada.im platform, ChartGen's version evolution is synchronized with the platform iteration, rather than being released with independent version numbers. The official independent version number of ChartGen has not been disclosed. The following milestones are based on the public function updates on the official website and the compilation of industry observable nodes.
End of 2024 (early launch stage)
- Establish the core product process of "upload data + natural language description → automatically generate pictures".
- At the initial stage of launch, it covers about 9 basic chart types (column, line, pie chart, area, scatter, combination, waterfall, funnel, heat map).
- The free tier is launched, positioned as a lightweight real-time visualization tool for individual users and small teams.
Early 2025 (functional expansion phase)
- Chart types expanded to 20+, with new financial charts (OHLC, K-line), professional charts (pyramid, rectangular tree, Sankey, dashboard) and flow charts (Gantt, mind map, flow chart).
- Launched 12 sets of consulting-level color matching themes and introduced a custom color selector to improve the aesthetics and brand adaptability of charts.
- External data source connections (Snowflake, AWS, Google Sheets) are online, extending from "one-time upload" to "real-time synchronization", opening up enterprise-level application scenarios.
Mid 2025 (platform integration phase)
- ChartGen is officially released as the core product capability of the Ada.im platform, and is deeply integrated with Ada.im's report engine Dashboard, PPT generation and other functions.
- The pricing system has been restructured from "billing based on the number of charts" to a "credits system", and four-level plans including Starter/Growth/Plus/Pro have been introduced, covering a complete customer base from individuals to enterprises.
- Announced SOC 2 compliance certification and opened up corporate procurement channels.
- API access and commercial authorization are released in the Pro plan, marking the evolution of the product from a pure web tool to a platform.
Current status (online version)
- Official website public data: 2 million+ chart generation, 50,000+ active users, 1,200+ corporate customers.
- G2 / SourceForge dual platform 4.8 points.
- The free tier of 50 pictures/month is positioned as the entrance to experience, and the paid tier is flexibly billed according to the complexity of the task through the credit point system.
Technical advantages of ChartGen AI
ChartGen’s technical competitiveness is reflected in “full-link intelligence from natural language to data charts” rather than a single model capability. The synergy of its technology stack is to integrate intent understanding, data mapping, visual rendering and security management into one package. Compared with similar tools (such as Julius AI, Rows AI), ChartGen focuses more on "chart output quality" rather than "data question and answer", and has more advantages in chart aesthetics and export flexibility.
Natural language intent parsing engine: The core technical barrier of ChartGen is to parse the user's fuzzy description (such as "Look at the revenue trend of each quarter") into a structured query - including chart type selection, X/Y axis field mapping, aggregation method (Sum/Avg/Count/Min/Max/Distinct) matching, and time granularity alignment. This process involves a hybrid architecture of NLU (natural language understanding) + rule engine + data schema inference, rather than pure large model invocation. Effectively, the user gives a description such as "Comparison of gross profit in the first half of the year by product line" without specifying a "grouped histogram" or "X-axis = product line, Y-axis = gross profit" - the system automatically completes the full-link mapping. The advantage of this hybrid architecture is that a pure LLM may not have an accurate understanding of the applicable boundaries of a specific chart type, while a rules engine can ensure professional soundness of chart selection.
Data Schema automatic inference: After uploading CSV or Excel, AI automatically detects column data types (text/date/numeric), identifies time field granularity (year/quarter/month/day), and marks dimensions and measures. This is the basis for subsequent chart recommendations. For raw data with irregular headers, its fault tolerance determines whether users need to perform data cleaning in advance - this is crucial for front-line business users. When testing, it is recommended to use a copy of actual business data (including dirty data) to verify the accuracy of Schema inference.
Real-time data synchronization mechanism: ChartGen provides direct connections to external data sources such as Snowflake, AWS, Google Sheets, etc. instead of one-time data import. This means that when the source data changes, the chart is automatically refreshed, which is suitable for the Dashboard scenario of "data update → automatic report update". The technical prerequisite for this capability is connector maintenance and credential security management, and SOC 2 compliance provides the basic guarantee for this. The coverage and maintenance frequency of the connector determine the reliability of real-time synchronization. It is recommended that enterprises confirm whether the target data source has an official connector before purchasing.
Multi-format output engine: The same diagram can be exported to PNG (raster), SVG (vector) and PDF (document), and can be directly embedded in PPT. This requires the rendering engine to support both Web Canvas/Vega class front-end rendering and back-end PDF/SVG rendering, and maintain visual consistency between different output formats. The SVG export capability is especially important for users who need to further edit their diagrams in Illustrator or PowerPoint.
Security and Compliance Architecture: SOC 2 compliance certification is a core access condition for enterprise procurement. ChartGen's design is "real-time processing of uploaded files without retention + HTTPS encrypted transmission", which corresponds to GDPR and general enterprise data protection requirements at the data privacy level. However, the specific scope and audit cycle of the SOC 2 report have not been made public, and enterprises need to request the complete SOC 2 Type II report before purchasing. In addition, after the data is encrypted during transmission, the memory security during processing and the server-side log retention policy also need to be included in the assessment scope.
How to use ChartGen AI
As a web online tool, ChartGen uses portals and paths to hierarchically match user roles and data scale. The overall usage threshold is low, and it takes about 2-3 minutes from registration to generating the first chart.
Standard usage process:
- Open chartgen.ai and enter the online workbench.
- Upload or connect data: Drag and drop CSV/Excel files, paste data, or connect to external sources like Snowflake/Google Sheets.
- Use natural language to describe requirements: Use Chinese or English to describe the desired chart in the input box, such as "Show revenue comparison of each product line by quarter."
- AI generates charts and previews: The system returns the chart within seconds and automatically applies the color theme.
- Adjustment and export: Fine-tune through AI dialogue or UI panel, and finally export to PNG/SVG/PDF or publish to Dashboard.
Data Preparation Tips: ChartGen’s basic requirement for input data is that the header row and column structure should be relatively regular. Irregular Excel with merged cells, multi-layer headers or a large number of blank rows needs to be preprocessed in advance. The official website provides sample data sets (Sales/Marketing/Finance/Survey/HR/E-commerce) for new users to quickly test, which reduces the cost of trial and error during first use. It is recommended that new users first use official sample data to familiarize themselves with the effect of natural language description, and then use their own data for formal verification.
The key functional differences between the free tier and the paid tier:
| Capabilities | Free tier | Paid tier (from Starter) | Exclusive to higher plans |
|---|---|---|---|
| Monthly output limit | 50 charts | 1,000-16,000 credits/month | — |
| Data source | Single file/single connection | 2-3 | Plus from 5-20+ |
| Export without watermark | ✗ | ✓ | — |
| API Access | ✗ | ✗ | Starting from Pro ✓ |
| Commercial License | Not Included | Unclear | Starting from Pro ✓ |
| Scheduled tasks | ✗ | ✗ | Starting from Plus ✓ |
| SSO/Audit | ✗ | ✗ | From Plus/Pro |
Entrance Category:
- Web Online Version: chartgen.ai, no installation required, suitable for quick use by individuals and teams, all functions are completed through the browser.
- API access: The Pro plan provides API access and can embed chart generation capabilities into your own systems (CRM, ERP, internal reporting platforms), but the API documentation and rate limit are subject to the official developer documentation.
- Dashboard publishing: After generating a chart, it can be published as an online Dashboard and shared with the team or customers through a link without the need for the other party to have a ChartGen account.
Product Pricing for ChartGen AI
ChartGen uses a credits billing system, tiered by monthly subscription. All paid plans have a 50% discount for the first month, but the credit point system and pay-as-you-go billing rules after overage have not been officially disclosed. The following information is subject to the real-time display on the official website pricing page. Comparing with similar tools: Canva’s paid plan is about $12.99/month, Tableau’s Creator license is about $75/month, and ChartGen’s Plus plan is $25/month, which is in the low-to-mid range.
Plan Tiers and Pricing:
| Plan | Monthly fee (after first month discount) | Monthly credits | Core differences |
|---|---|---|---|
| Free | $0 | 50 charts | Single data source with PNG watermark |
| Starter | $5 | 1,000 | No watermark, 2 data sources, PPT 15 pages |
| Growth | $12.5 | 3,000 | 3 data sources, 7-day free trial |
| Plus | $25 | 7,000 | 5 data sources, scheduled tasks, SSO, PPT 20 pages |
| Pro | $50 | 16,000 | 20+ data sources, API access, commercial licensing, audit logs |
Credit System Description: ChartGen no longer charges "per chart", but consumes credits based on task complexity. A simple chart consumes far less credits than a cross-source data merge + multi-page PPT generation. The advantage of this billing method is flexibility - teams suitable for occasional high-complexity tasks do not need to purchase high plans. However, this "billing by complexity" model also makes cost prediction difficult. Enterprises need to measure the credit consumption of typical tasks to calculate monthly budgets. It is recommended to obtain the credit consumption comparison table from the Ada.im team before purchasing.
True Boundaries for Free Tier:
- 50 pictures/month: basically enough for individual users who update data 1-2 times a week; not enough for daily updates or high-frequency exploration scenarios.
- PNG Watermark: Free export with watermark, can be used directly for internal reference but not suitable for external reporting.
- Single Data Source: Cannot do cross-file merging or external data source connection.
- Commercial authorization is not clear: Whether the charts generated by the free tier can be used for commercial release shall be subject to the official terms of service.
Key verification items before corporate procurement:
- Credit consumption model: Ask the Ada.im business team to provide a credit consumption comparison table for typical tasks to measure the coverage of different plans on the actual workload.
- Commercial Authorization Boundary: The Pro plan explicitly includes commercial authorization, and the authorization terms of Starter/Growth/Plus need to be confirmed in the contract.
- Private deployment: The privatization/On-premise solution does not appear on the public pricing page. Enterprises with strict compliance requirements need to confirm separately.
- Data retention policy: Although real-time processing of files is not retained, the storage location, retention period and deletion mechanism of the generated charts and dashboard data on the server must be confirmed in the DPA.
- SLA and Support: The Pro plan is marked with SLA Support, and there is no SLA for Plus and below. In high-availability scenarios, you need to choose the right plan level.
ChartGen AI application scenarios
ChartGen's capability boundaries determine that it is best at lightweight, high-frequency scenarios of "data → chart → sharing", but is not suitable for professional BI workflows that require in-depth interactive analysis or complex data modeling. The following four scenarios correspond to different user roles and data complexity respectively. Enterprises can choose the verification entry point according to their own needs.
Financial Reporting and Operational Analysis
- Task type: Monthly/quarterly financial data visualization, revenue analysis, profit trends, budget comparison, expense structure breakdown.
- Actual Benefits: A Fortune 500 CFO quoted on the official website reported that "report preparation time is reduced by 75%", and the process from raw data to finished charts can be completed in minutes. The financial team's monthly fixed-format report output can be standardized into templates to further reduce repetitive work. For the financial team, the value of ChartGen is not only “faster chart production”, but also the fact that “financial staff do not need to have data visualization expertise”.
- Verification focus: Financial data has extremely high requirements on the accuracy of charts and digital labels. It is necessary to verify ChartGen's rendering capabilities in details such as digital thousandths, decimal places, currency symbols, and the stability of generation under large amounts of data (10,000-line financial flows). It is recommended to use a real financial data (including negative values, percentages, currency columns) for a test run.
Marketing Data Analysis
- Task type: Campaign performance comparison, channel attribution ROI calculation, social media performance tracking, conversion funnel analysis.
- Actual Benefits: The official website article quoted a SaaS marketing director’s feedback that “Campaign reporting speed increased by 3 times.” Marketing teams usually need to produce multiple channel analysis reports every week. ChartGen's cross-data source merging capabilities (from Plus) are suitable for pulling data from different channels together for comparative analysis. The typical process in a marketing scenario is to export data from Google Analytics, Facebook Ads, and LinkedIn Ads respectively, and then merge them to generate a unified report.
- Verification focus: Marketing data usually has fine time granularity (daily/weekly), and it is necessary to verify ChartGen's rendering performance and chart readability when processing high-frequency time series data, as well as the data consistency after merging across data sources.
Content creation and social media graphics
- Task Type: Quickly generate data visualization graphics for blog posts, social media posts, e-books, and white papers.
- Actual benefits: From raw data to publishable charts can be completed within 5 minutes, eliminating the need to open Excel/PS/Canva to manually configure charts and then take screenshots. 12 sets of consulting-grade color themes adapt to different brand tone scenarios. For the content team, ChartGen solves the pain point of “slow and unprofessional chart creation”, allowing editors with non-design backgrounds to produce professional-level data graphics.
- Key points to verify: Whether the resolution and format (PNG/SVG/PDF) of the exported charts meet the publication requirements, and whether the watermark-free export is covered in the corresponding plan. In scenarios where publication quality is required, it is recommended to check the vector fidelity of SVG export.
Ad hoc data exploration
- Task Type: Rapid visual mapping of new data sets, exploratory analysis, and initial inspection of data quality.
- Actual benefits: After uploading the data, you can ask questions repeatedly through natural language ("View by region", "View by month", "Change to pie chart"), which is faster than dragging fields with traditional BI tools. This "conversational exploration" mode is suitable for data analysts to quickly understand data distribution and outliers before formal modeling.
- Verification focus: The accuracy and error correction experience of natural language understanding under complex queries (multi-condition filtering, calculated fields, comparison periods). If understanding biases are frequently encountered during exploration, the practical value of the tool will be significantly reduced.
Not suitable for scenarios:
- Interactive Dashboard: The Dashboard generated by ChartGen is static or regularly refreshed, and does not support interactive exploration such as user click-drilling and linkage filtering. If you need Tableau or Power BI level interactive analysis capabilities, ChartGen is no substitute.
- Complex Data Modeling: Professional BI operations such as custom calculated fields, window functions, and multi-table association modeling are not supported. Data preparation still needs to be done in external tools.
- Large Capacity Data: The free tier has a 100MB file limit, and the Pro tier has an undisclosed upper limit, but the web-side rendering performance determines that it has a bottleneck in front of millions of rows of data. It is recommended to sample or aggregate large data sets before importing them.
- Brand-level chart specifications: Although 12 sets of themes and custom colors are provided, the adaptability of automated charts to companies with strict brand visual specifications (specific fonts, spacing, alignment rules) is limited.
Applicable groups of ChartGen AI
ChartGen’s “configuration-free, natural language-driven” feature determines that its core audience is those who “have data but don’t want to learn BI tools.” The following four categories of people are arranged from high to low in suitability.
- Business Analysts & Non-Technical Teams (Finance, Marketing, Operations): This is the best match for ChartGen. They are exposed to data (sales tables, channel reports, financial flows) every day, but lack SQL/BI tool skills - ChartGen's "picture in one sentence" directly eliminates the learning curve. For this group of people, the free tier is sufficient to evaluate the daily reach of the tool. If one person in the team can be responsible for data preprocessing (ensuring that the CSV/Excel format is regular), the remaining members can complete the plot independently.
- Content Creators and New Media Operators: Need to produce data graphics for articles, reports, and social media, but do not want to spend time on repeated adjustments to chart styles. The 12 sets of color matching themes and the function of exporting to social media directly correspond to the pain points of this scenario. Exporting without watermark is subject to payment. A typical scenario for the content team is weekly data reports or market insight articles. ChartGen can reduce the time of producing illustrations by more than 80%.
- Managers of small and medium-sized teams: Need to regularly check the trends of the team's key indicators, but there is no full-time data analyst to configure the Dashboard. ChartGen's "Upload data → Describe requirements → Share Dashboard" process allows managers to build a usable data dashboard in minutes. For such users, the free tier + low-profile paid plan can meet their needs.
- Developer and Product Team (Pro Plan): Embed chart generation into your own products through API, suitable for adding data visualization modules to CRM, ERP or internal reports. Requires Pro plan API access and commercial licensing. Developers need to focus on the rate limit, response time and credit consumption model of the API to ensure that the cost after integration is controllable.
Not suitable for the crowd and prerequisites:
- Professional data analysts/BI teams: Teams that require in-depth interactive analysis (drilling, linkage, custom calculations), high-frequency real-time data flow modeling, or have refined control requirements for data permissions. ChartGen's lightweight model cannot replace professional tools such as Tableau/Power BI/Metabase.
- Teams with unstandardized data: If the team's data sources still rely on manual Excel merging and lack a unified table structure, even if ChartGen can automatically infer Schema, data preparation itself will still consume a lot of manpower - this is not a problem that tools can solve. It is recommended to complete the standardization of data infrastructure before introducing ChartGen.
- High Compliance Industries (Finance, Healthcare, Government Affairs): Although ChartGen claims to be SOC 2 compliant, the privatization deployment plan has not been made public. Industries such as finance/healthcare that have strict requirements for data not to be exported need to confirm the deployment plan separately. Additionally, the Data Processing Clause (DPA) in ChartGen’s Terms of Service requires review by the legal team.
Summary and Outlook
The core competitiveness of ChartGen AI lies in the one-step ability of "data → natural language → professional charts". The core competitiveness is not "being able to draw many kinds of charts", but "allowing people who don't know how to select charts or configure parameters to get usable charts in a few seconds." It is most suitable for data visualization scenarios that are lightweight, high-frequency, and do not require deep interaction. 2 million+ charts generated public data of 50,000+ active users and a G2 4.8 rating indicate that the product has gone through verification from 0 to 1 and entered the stage of large-scale use. Among similar tools, ChartGen’s differentiated advantages lie in chart aesthetics, output format diversity, and deep integration with the Ada.im platform.
The current main limitations lie in four aspects: first, the lack of in-depth interactive capabilities (drilling, linkage filtering), which is not suitable to replace professional BI tools; second, the credit point billing model complicates cost prediction, and the team needs actual measurements to establish a budget model; third, the privatized deployment plan is not disclosed, which has limitations for industries sensitive to data sovereignty; fourth, as the product capabilities of the Ada.im platform, its iteration roadmap and business terms are deeply bound to the platform, and independent procurement and migration costs need to be included in the assessment. In addition, although there are more than 20 chart types, it still lacks common chart types such as geographical maps, bubble charts, and radar charts.
Follow-up evolution directions worthy of attention include: whether chart types are further expanded to geographical maps and 3D visualization, the accuracy of natural language understanding on complex queries (multi-level filtering, conditional calculations) is improved, the openness of the API ecosystem (whether custom connectors are allowed), and whether the Ada.im platform as a whole launches an enterprise privatized deployment plan. If the Ada.im platform continues to expand its Agent capabilities and data connector ecosystem, the value of ChartGen as its visualization layer will further increase.
Procurement and Adoption Risk Assessment: It is recommended that the team first use the free tier (50 images/month) to complete 2-4 weeks of verification on actual business data, focusing on testing natural language understanding accuracy, data format compatibility, and credit consumption of typical tasks. After passing the verification, start with the Starter or Growth plan, and expand to Plus or Pro after running through 1-2 analysis links. Before purchasing, enterprises must confirm with the Ada.im business team: commercial authorization coverage, SOC 2 Type II report, data storage location and retention strategy, and whether there is a timetable for enterprise-level privatization deployment. Organizations with high data compliance requirements or in-depth interactive analysis should avoid large investments before examining complete enterprise solutions. Overall evaluation: ChartGen is a lightweight tool suitable for "quick charting and high-frequency reporting" scenarios, and is suitable as a supplement rather than a replacement for enterprise-level BI needs.
Related tools:
Version Info
- ChartGen AI (Web) :Online AI chart generation service that supports drag-and-drop CSV/Excel, describes chart requirements in natural language, and automatically generates downloadable professional charts. The official unified version number and exact date have not been disclosed, and the dates are approximate.
- ChartGen AI early online version :The early online version establishes the core process of "uploading data + natural language description = automatic rendering". The exact date has not been officially announced, but is an approximation.
User Reviews