 Datadog
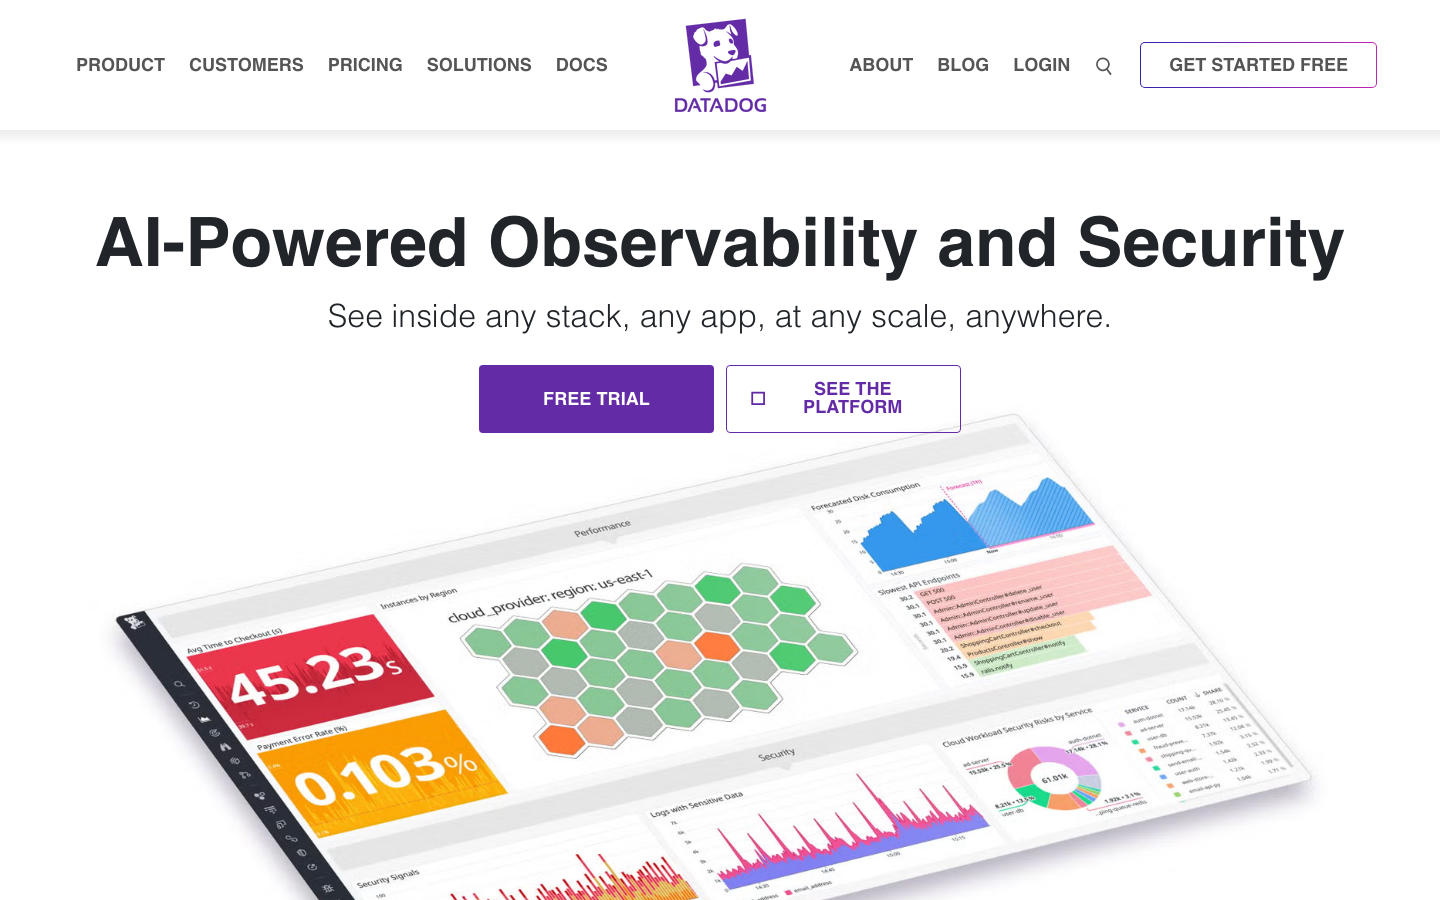
Datadog is the industry's leading AI-driven observability and security platform for DevOps, SRE and platform engineering teams. It integrates infrastructure monitoring APM, log management, security analysis and AIOps, and supports unified monitoring and intelligent operation and maintenance of multi-cloud and hybrid architectures.
Datadog
Core parameters and statistics
Datadog is an AI-driven observability platform for enterprise-level cloud environments, officially positioned as "The essential cloud monitoring platform". It integrates infrastructure monitoring, application performance management (APM), log management, security analysis and AI operations (AIOps) into a unified data plane, and its target customer base covers DevOps, SRE, platform engineering and security teams.
| Projects | Public Information |
|---|---|
| Official positioning | The essential cloud monitoring platform |
| Product Form | SaaS Cloud Platform + Agent Collection Terminal |
| Core competency areas | Infrastructure monitoring APM, log management, security monitoring AIOps, Bits AI |
| AI product line | Bits AI (natural language operation and maintenance assistant), Watchdog (automatic anomaly detection) |
| Deployment path | SaaS cloud (multi-region), private solution (Datadog GovCloud) |
| Integration Ecosystem | 700+ official integrations, covering AWS, Azure, GCP, Kubernetes, etc. |
| Customer scale | Used by more than 50% of Fortune 100 companies (official disclosure) |
| Listing Information | NASDAQ: DDOG |
Product Form: Datadog adopts a SaaS centralized architecture, deploys lightweight Agents to various environments to collect data, and aggregates, analyzes and alerts uniformly in the cloud. The advantage of this architecture is that it works out of the box and does not require self-built storage, but data export fees and long-term storage costs need to be included in budget evaluations.
AI embedding depth: Bits AI is Datadog’s core investment in AI since 2025. It embeds natural language query, event root cause analysis, and intelligent alarm aggregation directly into the operation and maintenance workflow, rather than existing as an independent AI panel. This means that the depth of use of AI capabilities depends on the quality and completeness of access to existing data.
Ecological Coverage: 700+ official integrations are one of Datadog’s core moats. In a hybrid cloud or multi-cloud environment, the operation and maintenance team can avoid building separate monitoring stacks for different cloud vendors, but this also means that once they are deeply bound, migration costs will increase significantly.
User and market recognition
Datadog is a publicly listed leader in the observability field, and its market recognition is reflected in the dual dimensions of customer scale and capital market.
Enterprise customer coverage: Officially disclosed, more than 50% of the Fortune 100 are Datadog customers, with customers located in finance, retail, technology, medical and other industries. Its biggest selling point is "one-stop replacement" - using a unified platform to replace the originally scattered multiple sets of open source tool combinations (such as Prometheus + ELK + Grafana).
Capital Market Validation: Datadog (NASDAQ: DDOG) is an iconic public company in the SaaS space, with a long-term market capitalization of over $30 billion. Continuous mergers and acquisitions after listing (such as the integration of AI operation and maintenance company Seekret and log analysis platform Logz.io assets) have further strengthened its technical depth of AI observability.
Competitive positioning: On the observability track, Datadog is in direct competition with New Relic, Dynatrace, and Grafana Labs. The core advantage of Datadog lies in the breadth of integrations (700+ integrations) and enterprise-level delivery capabilities. The disadvantage is that the monthly bill for full use may not be friendly to small and medium-sized teams.
Cost advantage
Datadog's pricing structure is mainly divided into two levels: Pro and Enterprise. The billing dimensions are calculated separately by product line (Infrastructure, APM, Logs, Synthetics, etc.). It does not support the "fixed price" all-inclusive model. This is especially important to pay attention to when purchasing.
C-side/Individual: Datadog does not have a permanent free version, but it provides a 14-day free trial of the Pro plan, which requires a credit card to be bound. For individual developers or learning purposes, free community alternatives like Grafana + Prometheus are more practical.
API/Developer: Datadog API is billed based on call volume and data volume. If developers write a large amount of custom metrics or logs through the API, the cost will increase linearly with the amount of data. Take custom metrics as an example. After the free quota is exceeded (the Pro plan includes 100 custom metrics), you will be billed for every 100 metrics. If you bury too many points in a long-running test, you may accidentally generate a high bill.
Enterprise/Private: The Enterprise plan provides a customized committed consumption contract (Annual Contract + Commit), which usually includes discounts, dedicated support and SLA improvements. Privatized options (GovCloud or private deployment) require separate business negotiation. Hidden costs mainly come from three aspects: data export fees (especially multi-region cross-cloud scenarios), long-term log/metric storage fees (storage costs beyond the default retention period), and infrastructure monitoring fees caused by the expansion of the number of Agents.
Main functions
Datadog's capabilities are designed around "unifying monitoring, analysis, AI and collaboration into one platform". The public capabilities can be summarized into six core modules:
- Infrastructure Monitoring: Supports automatic discovery and monitoring of 700+ technology stacks, covering hosts, containers Kubernetes, Serverless and serverless architectures. The key value lies in automatically generating a bounded topology map and reducing the workload of manually configuring monitoring items.
- APM & Distributed Tracing: Supports automatic tracking and distributed tracing in multiple languages (Java, Python, Go, Node.js, etc.), and can track the complete call chain of requests between microservices. When troubleshooting cross-service performance bottlenecks, there is no need to read logs on a service-by-service basis.
- Log Management: centralized collection, analysis, indexing and search of logs, supports Live Tail real-time viewing. When associated with APM and infrastructure metrics, problem location can be accomplished across metrics-trace-logs in a single query.
- Bits AI Operation and Maintenance Assistant: A natural language interface launched in 2025, which can use daily language to query system status, perform operation and maintenance operations, and analyze the root cause of events. For example, if you directly ask "the reason why the error rate of payment services increased in the past hour", Bits AI will automatically give an answer across data sources.
- Watchdog automatic anomaly detection: Automatically detect indicator anomalies based on historical baselines without manual configuration of alarm thresholds. It is especially useful for large-scale microservices because it can cover thousands of indicators that are difficult to manually configure one by one.
- Cloud Cost Management: Incorporate cloud cost data into the observability surface and correlate resource usage and cost changes. Suitable for FinOps scenarios, you can see cost optimization suggestions directly in the operation and maintenance panel.
Model and version evolution
The relevant information has not been made public, please refer to the official real-time page.
Technical advantages
Datadog's technical advantages come from the architectural design of "unified data plane + AI embedded workflow" rather than a single algorithm performance:
Unified data framework construction: Put the collection, storage, query and analysis of three data types: metrics, traces, and logs on the same platform. Users do not need to switch between different tools. From a technical perspective, this means that cross-data type related queries (such as "check the logs and indicators corresponding to a trace ID") do not require data export and secondary processing, and the troubleshooting efficiency is significantly improved.
Bits AI's natural language workflow: Unlike traditional AI panels, Bits AI is directly embedded in Datadog's UI and API layer, and users can complete queries, analysis, diagnosis and even operation execution in natural language. This reduces the cognitive load of operation and maintenance personnel switching between different panels, but the effect is highly dependent on the integrity and annotation quality of the queried data source.
Watchdog’s threshold-free anomaly detection: Based on machine learning baseline modeling, it automatically learns the normal fluctuation range of each indicator without manually setting static thresholds. In large-scale microservice scenarios, this solves the pain point of "too many indicators and endless threshold settings". However, in business indicators that fluctuate periodically, there may be more false positives during the initial learning period.
Agent's lightweight collection: Datadog Agent is written in Go. Its resource occupancy has been optimized for many years, and its impact on host performance is usually controlled within 2-5%. However, for existing high-load nodes, it is still recommended to fully deploy them after staging verification.
How to use
Datadog uses the SaaS platform as the core entrance, and all functions are exposed through Web UI, Mobile App and REST API:
| How to use | Suitable for the crowd | Features | Cost |
|---|---|---|---|
| Web UI | DevOps, SRE, Platform Engineer | One-stop dashboard, alarm APM and log query | Subscribe by Pro/Enterprise |
| Mobile App | Operation and maintenance personnel | Alarm notification, event response, dashboard viewing | Included in subscription |
| REST API | Developer, automation platform | Data writing, query, metadata management, automated configuration | Billing based on API calls |
| Terraform Provider | IaC Team | Manage Datadog resource configuration through Terraform | No additional cost |
The actual steps of use are usually: first deploy Datadog Agent on the target host/container → enable required data collection (Infrastructure, APM, Logs) → configure dashboards and alarms in the Web UI → integrate Bits AI and Watchdog as needed. After the Agent is deployed, it is recommended to spend time on the Dashboard to verify that the data has arrived correctly, and then gradually access the alarm and AI capabilities to avoid false alarms caused by data distortion.
Product Pricing
Datadog's pricing is billed separately by product line, and the overall feature is "cumulative based on data volume/number of hosts", and the full usage cost needs to be calculated one by one.
- C client/individual: The Pro plan is billed by host (Infrastructure is about $15/host/month), with a 14-day free trial. The monthly fee for a single host or small-scale testing is at the level of several hundred yuan.
- Developer/API: APM is billed by traced host (Pro is about $31/host/month), Log Management is billed by ingested log volume (Pro is about $1.27/GB/month). Developers need to pay attention to the writing volume of custom metrics and logs, because the expansion of data volume under the pay-as-you-go billing model will directly push up the monthly bill.
- Enterprise: Enterprise plans are on an annual contract and include discounts, dedicated support, and SLA upgrades. Before purchasing, it is recommended that enterprises run a POC and make cost estimates based on the real data volume (number of hosts, log volume, APM trace volume), and then use the full volume estimate to negotiate with sales. Hidden costs include cross-region data transfer and ultra-long-term data retention fees, which are easily overlooked in monthly statements.
Application scenarios
Datadog's implementation scenarios focus on multi-cloud/hybrid cloud environments that require unified monitoring:
- Microservice architecture full-stack monitoring: end-to-end observability from infrastructure (Kubernetes nodes, containers) to application layer (API response time, error rate, database query performance) to user experience (front-end loading time). It is suitable for medium and large-scale microservice deployment. Traditional single applications cannot use the value of APM distributed tracing.
- Cloud Cost Management (FinOps): Correlate resource usage with actual cloud spend through Cloud Cost Management, identifying idle resources and optimizable instances. For organizations with multi-cloud or large-scale cloud resources, the monthly cloud cost optimization ratio is usually in the range of 10-30% (based on industry deductions), but it depends on the proportion of idle resources and the execution ability of the team.
- SRE duty and incident response: Bits AI’s root cause analysis Watchdog’s automatic anomaly detection combined with PagerDuty/Slack’s alarm notifications shortens MTTR (mean time to repair). Preliminary deduction: After accessing Bits AI, the initial screening time for incident troubleshooting can be reduced from 20 minutes to 3-5 minutes (provided that the data coverage is complete).
Applicable people
Datadog’s multi-product line strategy serves three typical roles:
- SRE and DevOps Engineers: A unified observability platform is needed to manage metrics, tracking and logs in multi-cloud contexts. Bits AI can reduce duplication of daily troubleshooting work, but only if the team has basic data collection specifications.
- Platform Engineering Team: Need to provide a standardized monitoring base for multiple internal business lines. Datadog's Terraform Provider and API enable it to be managed as an observability middle ground in platform projects.
- Technical Manager (VP/CTO): Focus on unified monitoring and cost visibility across teams. Cloud Cost Management provides a dashboard that works backwards from resource usage to cost optimization opportunities, suitable for use in FinOps decision-making meetings.
Unsuitable Team: The cost and complexity of using Datadog is not cost-effective for small teams or single application scenarios (such as a single Rails application), and free alternatives (Prometheus + Grafana + Loki) are sufficient in single application scenarios. In addition, for situations where offline/private network isolation is strong, Datadog's SaaS architecture may have data export restrictions. It is recommended to first evaluate Datadog for Government or alternatives.
Summary and Outlook
Datadog's core competitiveness lies in the trinity of "unified data plane + AI embedded workflow + 700+ integrations". It is not the cheapest observability solution, but a full-stack platform designed for large-scale organizations that "don't want to maintain multiple tool stacks." Bits AI and Watchdog represent the trend of AI operation and maintenance from "alarm aggregation" to "natural language diagnosis and root cause analysis".
Current limitations: Pricing is transparent but complex, and monthly bills for full usage need to be calculated item by item; Bits AI's Q&A quality is greatly affected by data coverage, and initial access may not achieve the demonstration effect; limited support for pure intranet connections.
Procurement/Adoption Risk Assessment: It is recommended to first select 1-2 business lines to do POC (2-4 weeks) to verify Agent compatibility, data collection integrity and Bits AI’s answer accuracy in real situations. Before signing an annual enterprise contract, you must confirm the data export fees, log storage overage fees, and data migration plans after the contract expires - Datadog's data export capabilities are usually free during the contract period, but large-scale data migration may require tool chain support.
Version evolution of Datadog
Datadog adopts the SaaS continuous delivery model and does not have independent version numbers in the traditional sense. Product capabilities are released in a quarterly release rhythm, and all customers are automatically updated to the latest version without manual upgrades.
Bits AI ability line
- 2025-Q3: Bits AI is released for the first time, embedded in the Datadog platform as a ChatOps interface, supporting natural language query metrics and logs.
- 2026-Q1: Bits AI enhancements, adding automated workflow execution capabilities, can create monitoring dashboards and adjust alarm settings based on natural language instructions.
- 2026-Q2: Bits AI is integrated into the event management process, supporting AI-assisted root cause analysis and automatic generation of event summaries.
Watchdog ability line
- 2024-Q4: Watchdog has expanded from indicator anomaly detection to log mode anomaly identification, reducing manual writing of log alarm rules.
- 2025-Q4: Watchdog introduces multi-dimensional anomaly correlation across indicators-tracking-logs to reduce false positive rates.
- 2026-Q2: Watchdog is upgraded to an AI-driven root cause analysis engine that can automatically speculate on possible cause chains after detecting anomalies.
Due to the nature of SaaS, it is recommended to use the official Release Notes (docs.datadoghq.com/release_notes/) as the first source of information for the latest capability changes. It is officially recommended to pay attention to the official Changelog subscription to avoid automation script failure due to UI/API updates.
Version Info
- Datadog 2026-Q2 Release :Platform update in the second quarter of 2026, including Bits AI enhanced AI-driven anomaly detection upgrades and new Kubernetes monitoring capabilities.
- Datadog 2026-Q1 Release :The platform will be updated in the first quarter of 2026, introducing an enhanced version of Bits AI natural language operation and maintenance assistant Cloud Cost Management.
- Datadog 2025-Q4 Release :Updated in the fourth quarter of 2025, new AI operation and maintenance workflow automation and intelligent alarm noise reduction functions will be added.
User Reviews