 Figure Labs
Free
Figure Labs
Free
Figure Labs is an AI-driven 3D character and character asset generation platform that supports generating usable 3D character models from text or images. It provides rapid 3D modeling capabilities for game development, virtual reality and digital human applications, lowering the entry barrier to 3D character production.
FigureLabs
Core parameters and statistics of Figure Labs
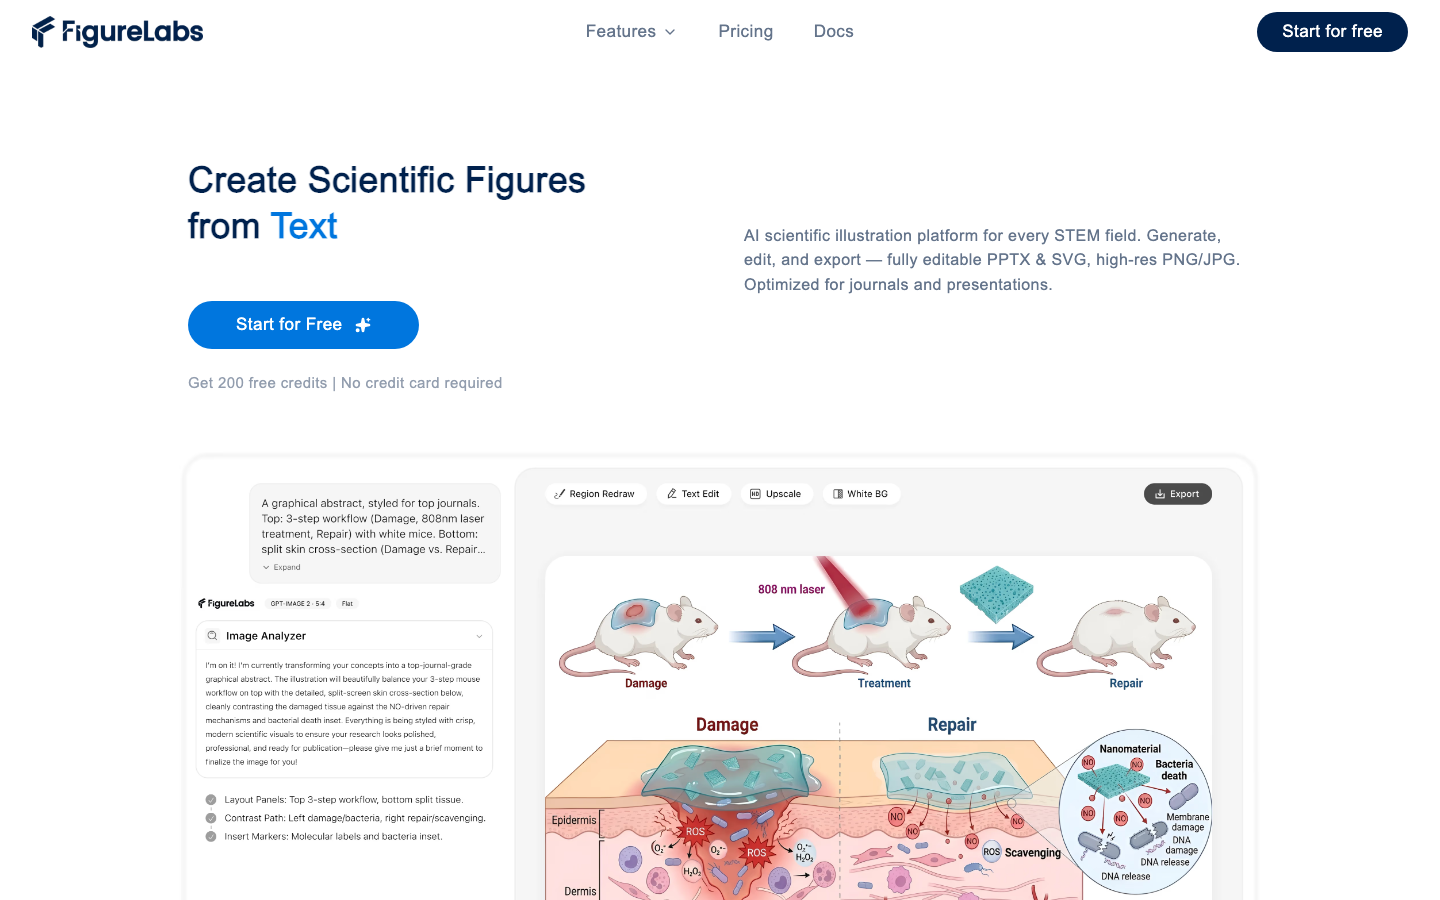
Figure Labs (figurelabs.ai) is the world's first AI scientific illustration Agent (academic diagram generation tool), positioned as Type D (productivity/business application) - an end-to-end scientific research drawing platform for STEM researchers, with Type A (Agent/automated tool) characteristics: it is not a library drag and drop tool, but an AI Agent that can understand research descriptions and independently generate publishable scientific diagrams.
| Projects | Public Information |
|---|---|
| Product Positioning | The world's first AI Agent-driven scientific illustration platform |
| Core Competencies | Text/PDF to scientific diagrams, sketches to illustrations, reference drawing style transfer AI vector export |
| Target subjects | Life sciences, engineering, physics, chemistry, computer science |
| Platform | Web |
| Home | US |
| Business model | Freemium (free tier + 4 tier subscriptions) |
| User scale | 400K+ researchers |
| Output format | PNG / JPG (up to 8K), SVG (editable vector), PPTX (editable slideshow) |
| Publication License | Free tier for non-commercial use only; paid tier has full publishing rights |
| Data Privacy | No data is uploaded to train the AI model, and the transmission and storage are fully encrypted |
A brief comment: Figure Labs is not another BioRender clone, but uses generative AI to replace the entire process of "starting from a blank canvas" in scientific research drawing - researchers only need to describe the experimental design or upload a sketch, and the AI Agent can autonomously complete schematic diagram generation, annotation editing and vector export, which can be directly used for journal submission.
Figure Labs users and market recognition
User base
Figure Labs claims to serve 400K+ researchers from the world's leading scientific research institutions (the partner logo displayed on the official website covers universities, research institutes and medical institutions). This level of magnitude is at the top level in the scientific research drawing tool track - compared to BioRender (about 1 million+ users, but established more than 10 years ago), Figure Labs's growth rate is quite impressive.
Market positioning
The traditional scientific research drawing market is dominated by two types of tools:
| Tool Type | Representative Products | Core Limitations |
|---|---|---|
| Library-style drag and drop | BioRender | Life science only, the icon library is limited and unpreset components cannot be generated |
| Universal manual drawing | PowerPoint / Adobe Illustrator / Inkscape | Steep learning curve, 4-12 hours per drawing, no scientific template |
| AI Generative | Figure Labs | Interdisciplinary, Unlimited Customization, 10x Efficiency Improvement |
BioRender has established a strong brand in the field of life sciences, but its "drag and drop from the preset icon library" model essentially limits the boundaries of scientific expression—researchers can only use icons that have been drawn by the BioRender team. Figure Labs’ generative path breaks through this limitation: any discipline or any structure can be described by text or sketches, and the AI Agent can generate the corresponding schematic diagram.
Third-party reference
Products currently on the market that directly compete with Figure Labs include BioRender (manual drag and drop), Mind the Graph (templating), and general AI image generation tools (Midjourney/DALL·E), but the latter lacks scientific precision control and cannot output editable vector formats for journal submission. Figure Labs fills the gap between "AI generation" and "journal-grade vector output".
Figure Labs Cost Advantage
C-side/Individual researcher
| Plans | Monthly fee (paid annually) | Monthly credit limit | Daily refresh | Storage | Maximum export resolution | Vector export | Publishing license |
|---|---|---|---|---|---|---|---|
| Free | $0 | 150 (one-time) + 50/day | 50 credit | 1 GB | 1K HD | ❌ | ❌ (non-commercial only) |
| Starter | $10 ($120/year) | 1,000/month | 100 credit | 10 GB | 4K HD | SVG | ✅ |
| Plus | $20 ($240/year) | 5,000/month | 100 quota | 50 GB | 8K HD | SVG+PPTX+Canvas | ✅ |
| Pro | $54 ($648/year) | 20,000/month | 100 quota | 300 GB | 8K HD | SVG+PPTX+Canvas | ✅ |
Cost reduction and efficiency improvement deduction (based on Type D rules):
- Graduate student writing thesis: It usually takes 2-6 hours to manually draw a signal path diagram or experimental device schematic diagram (learning BioRender icon position + layout adjustment + exported format adaptation). Figure Labs compresses this process to 3-15 minutes (input description → AI generation → fine-tuning → export SVG/PPTX), improving efficiency by about 10-30 times.
- Postdoctoral preparation for manuscript submission: Journals have strict regulations on image resolution (usually ≥300 DPI), format (vector first vs bitmap) and figure caption format. Traditional workflows require repeated exporting/adjustment/re-rendering. Figure Labs can export 8K PNG or editable SVG with one click, directly shortening the export time from 30-60 minutes to 2 minutes.
- Professor/Team Leader Review: Inconsistent annotations and inconsistent styles are common pain points in pictures that are collaborated by multiple people in the group. The link of AI generation + vector editing ensures a unified style for the entire proofreading, reducing 20-30% of rework and communication costs.
API / Developer
No independent API is exposed. At the current stage, Figure Labs focuses on direct use on the Web and does not open programmatic access. This is a clear limitation for teams that require batch generation or integration into internal lab pipelines.
Enterprise / Team Plan
The official website lists Team Plan and Enterprise options (specific pricing is not disclosed), which supports credit limit rolling (up to 20% of unused credit is carried forward to the next month). Enterprise purchases need to contact the business to confirm volume discounts, privatized deployment and data compliance terms.
Main functions of Figure Labs
1. Text-to-Figure
Enter a natural language description or upload a PDF paper abstract, and the AI Agent automatically parses the scientific concepts, structural relationships and process logic and generates the corresponding scientific diagram. This is the core differentiating function of Figure Labs - it breaks through the traditional "select from a template or icon library" limitations, allowing researchers to describe "I need a schematic showing that CART-T cells recognize tumor cells and release perforin and granzymes" and get a first draft that can be used directly.
- Applicable tasks: Experimental flow diagram, mechanism description diagram, signal path diagram, methodology overview.
- Use Value: Eliminating the step of manually drawing each molecule/cell one by one, AI understands the spatial relationships and schematic rules of biological/chemical/physical entities.
2. Image-to-Figure
Transform hand-drawn sketches, cell phone photos of whiteboards, or rough concept maps into scientific illustrations with clean layout and uniform color. AI automatically denoises, aligns, completes details, and applies a scientific drawing style.
- Applicable tasks: Convert meeting whiteboard discussion diagrams into publishable illustrations, and digitize sketches in experimental notebooks.
- Use Value: Bypassing the highly repetitive work of "drawing it again", the original creativity is retained but the quality of the final image is greatly improved.
3. Reference-to-Figure style migration (Reference-to-Figure)
Upload any reference figure (Figure from a published paper, teaching wall chart, textbook illustration), the AI Agent analyzes its style, color scheme, layout and annotation, and then uses the same style to generate a new figure corresponding to your data/concept. This is especially useful for scenarios where it is necessary to maintain a consistent style for a group of pictures (such as multiple Figs in a paper).
- Applicable tasks: The style of multiple figures in the paper should be unified and consistent with the visual style of top journals.
- Use Value: Reduce repetitive formatting adjustments of "manually matching colors, fonts, and line styles".
4. AI editing suite
After the generation is completed, Figure Labs provides four AI-driven post-editing capabilities to avoid the switching loss of "returning to external software for modification":
- Text Edit: Modify labels, annotations, and text descriptions directly on the generated images, and AI automatically compensates for the background and layout—no need to regenerate the entire image.
- Region Redraw: Select only the unsatisfactory local area in the image (such as the shape of a molecule is inaccurate), and let AI only redraw this area, leaving the rest unchanged.
- BG Remove: Change the background to pure white/transparent with one click to meet the journal's requirement for a white background.
- Upscale (resolution upgrade): Supports three-level amplification of 2K (10 quotas), 4K (20 quotas), and 8K (40 quotas) to meet the DPI requirements of different journals (8K ≈ 1200 DPI).
Expert opinion: The real value of this set of AI editing capabilities does not lie in a single function, but in that they realize the full integration of "generate → review → local modification → export", avoiding the most common switching loss in scientific research drawings of "cut out and change → import back → format is wrong again". Region Redraw is the most practical among them - usually only 10-20% of the scientific research map needs to be accurately corrected, and redrawing the entire map is a waste of time and may introduce new errors.
5. Vector export: SVG / PPTX / Inline canvas
This is the core barrier that distinguishes Figure Labs from general AI image tools (Midjourney, DALL·E):
- SVG Export: Output 100% clean vector layers with clear layers and editable text, which can be directly opened by Adobe Illustrator and Inkscape for editing. The most important thing is that the SVG format has passed the strict publishing rule of the top journal "not accepting AI-generated raster images".
- PPTX Export: Directly export the generated diagram as a PowerPoint editable slide, and each layer of elements is a native PPT object. This is extremely friendly for team collaboration and defense PPT production.
- Built-in Canvas: Perform vector-level editing directly within the Figure Labs web page without switching to external tools.
Expert View: PPTX export is the most underestimated highlight of this feature set - in academic scenarios, 90% of the final presentation is completed in PowerPoint. The traditional method is to repeatedly screenshot → paste → zoom → transform, while Figure Labs' PPTX directly exports editable vector layers, fundamentally solving the adaptation problem of "from drawing tools to presentations".
Figure Labs model and version evolution
As of July 2026, Figure Labs is in a rapid iteration stage, and official public version information is limited. The following is compiled based on the public milestones and functional evolution trajectory of the official website:
| Time nodes | Milestones | Key changes |
|---|---|---|
| ~2025-06 | Initial version (v0.1 launch) | Product online, supporting basic Text-to-Figure and Image-to-Figure |
| ~2026-01 | Current version (v1.0 current) | Officially launched Reference-to-Figure, AI editing suite SVG/PPTX vector export |
| Under continuous development | Unpublished | Subject to the official release log |
The functional iteration of Figure Labs implies that its technical route is evolving from "single generation" to "Agent-style multi-round interaction + fine control": early versions focused on generation quality, and subsequent versions greatly enhanced editing capabilities and output format diversity. It is worth noting that it aggregates multiple third-party image generation models (Nano Banana 2/Pro, GPT Image 2/1.5, SeeDream 4.5, Seedream 5.0 Lite, Sora, Flux.2 Max). Users can access different levels of model pools in different plans. This "model aggregator" strategy makes its generation style and scientificity not dependent on a single base model.
Figure Labs’ technical advantages
Generative AI × Scientific Precision: Not Drawing Pictures, but Understanding Science
Figure Labs’ technical route is fundamentally different from traditional scientific research drawing tools:
- Traditional path (BioRender/PowerPoint): People select preset graphics from the icon library → manually drag and drop to arrange → manually add annotations → export. The bottleneck lies in the coverage of the icon library and the accuracy of human operation.
- AI Agent Path (Figure Labs): Humans use natural language or sketches to describe → AI understands scientific concepts and structural relationships → autonomously generates schematic diagrams → AI-assisted editing → vector export. The bottleneck lies in the accuracy of AI’s understanding of scientific domain knowledge.
Figure Labs’ competitive advantage is based on the synergy of the three-layer technology stack:
-
Scientific concept understanding layer: Map natural language descriptions to scientific entities (molecules, cells, structures, processes) and the spatial relationships between them. This is the fundamental difference between it and general image generation tools - general tools "draw good-looking but wrong drawings", Figure Labs needs to "draw good-looking" on the premise of "drawing right".
-
Multi-model aggregation orchestration layer: Aggregates multiple underlying generation models such as Nano Banana 2/Pro, GPT Image 2/1.5, SeeDream 4.5, Seedream 5.0 Lite, Sora, Flux.2 Max, etc., and automatically selects or allows the user to switch the most appropriate model according to the subject type of the generation task (biology vs physics vs engineering). This "model routing" mechanism is crucial in scientific research scenarios - immunology schematics and mechanical schematics have very different visual style requirements.
-
Vector conversion pipeline (AI Vectorizer): This is the part with the highest technical barriers. Generic AI image generators produce raster images (arrays of pixels) that cannot be directly converted to an editable vector format. Figure Labs’ proprietary AI Vectorizer extracts the mathematical description of a figure (paths, shapes, fills, text) from raster output and reconstructs it into cleanly layered vector layers. This technology directly determines whether its output can pass the journal's "vector first" acceptance criteria.
Interdisciplinary coverage: more than life sciences
The biggest limitation of BioRender is that it only covers the field of life sciences - when researchers need to draw neural network architecture diagrams, mechanical transmission system schematics, and quantum physics experimental devices, BioRender's icon library has no available materials at all. The generative path of Figure Labs is naturally not limited by the icon library and can theoretically cover the visualization needs of any discipline. The covered disciplines clearly listed on the official website include: life sciences, engineering, physics, chemistry, and computer science.
Mechanism→Effect→Applicable Scenario: The generative model itself has cross-domain generalization capabilities (based on massive multi-modal training data), so Figure Labs does not need to build separate graphics libraries for each subject like BioRender. This means that the cost of covering new subject scenarios approaches zero—as long as the model understands the scientific concept, it can generate the corresponding schematic diagram.
Engineering pitfall guide (for Agent/automation features)
As an AI Agent-type product, Figure Labs has the following typical engineering problems in actual use:
1. The illusion of scientific accuracy: AI may generate visually perfect but scientifically incorrect details (such as incorrect molecular positional relationships in signaling pathways, incorrect valence bonds in chemical structural formulas). This is different from the "fact illusion" of general AI, but the "visual illusion" - the picture looks right, but a knowledgeable person will know it is wrong at a glance.
- Solution: Region Redraw positioning repair + manual review cannot be skipped. Figure Labs is not a substitute for final confirmation of the scientific accuracy of images by a PI (Principal Investigator) or peer review.
2. Parsing bottleneck of long text/complex description: When the input is the abstract of an entire paper (300+ words), the AI Agent's attention may lose key details, and the generated graph may miss important components or confuse hierarchical relationships.
- Solution: Split the complex description into multiple short Prompts, generate them separately, and then merge them in subsequent editing/synthesis steps. Avoid having the Agent deal with too many scientific details at once.
3. Recognition of subject-specific symbols failed: Professional symbols in some non-common fields (such as specific mathematical symbols, engineering annotations, chemical substructures) may be misunderstood or simplified by AI.
- Solution: Use Image-to-Figure to upload hand-drawn sketches as strong constraints to reduce the free interpretation space of AI. Symbols in sketches, even if crude, provide clear structural anchors for the AI.
How to use Figure Labs
Entrance and access methods
| Access method | Applicable people | Start-up cost |
|---|---|---|
| Web (official website) | All users | Register and use, 200 initial quota |
| Team/Enterprise Solution | Laboratory/Research Group/Institution | Business Contact Required |
Figure Labs currently only provides web access, with no desktop app or API. Typical usage process:
- Registration: Visit figurelabs.ai → Register an account (supports email/Google/SSO) → Receive 150 one-time quota + 50 daily refresh quota (free tier); paid subscribers can refresh 100 quota daily.
- Select the generation mode: Text-to-Figure (text generation), Image-to-Figure (image conversion), Reference-to-Figure (reference image style migration).
- Enter description/upload material:
- Text mode: Enter a scientific description (supports Chinese and English), or upload a PDF paper abstract to automatically extract key concepts.
- Picture mode: Upload hand-drawn sketches/whiteboard photos/rough concept drawings.
- Reference figure mode: Upload an existing Figure as a style reference.
- AI generated diagram: The system generates preliminary results based on the input, which takes about 10-60 seconds (depending on the complexity of the graph).
- AI editing: Use Text Edit to correct the annotation text → Region Redraw to partially redraw the unsatisfactory parts → BG Remove to clean the background → Upscale to increase the resolution.
- Export: Select the export format (PNG/JPG/SVG/PPTX) → Preview on the webpage → Download. SVG and PPTX export costs 150 credits.
Credit limit consumption rules
| Operation | Consumption quota |
|---|---|
| Generate (1K resolution) | 50 |
| Text Edit | 60 |
| Region Redraw | 50 |
| BG Remove | 50 |
| Upscale 2K | 10 |
| Upscale 4K | 20 |
| Upscale 8K | 40 |
| SVG/PPTX vector export | 150 |
Figure Labs Product Pricing
Figure Labs uses a credit line + monthly subscription model. All AI models consume the same amount of money for the same operation, but the access rights of advanced models are bound to the subscription plan.
Personal subscription (monthly/yearly payment)
| Plan | Monthly payment price | Annual payment price (equivalent to monthly fee) | Monthly credit limit | Applicable to typical users |
|---|---|---|---|---|
| Free | $0 | $0 | 150 one-time + 50/day | Occasional students |
| Starter | $12 | $10 | 1,000 | Graduate students who need 10-20 images per month |
| Plus | $35 | $20 | 5,000 | Postdoc/Associate Researcher 20-50 images per week |
| Pro | $99 | $54 | 20,000 | High-use labs/PIs/team leaders |
Real Limitations of the Free Tier:
- After the 150 one-time quota is used up, only about 3 pictures can be generated for free every day (50 quota/day, each picture consumes 50 quota).
- The vector format (SVG/PPTX) cannot be exported, which means that the generated figures cannot be used for journal submission (most top journals require vector format).
- For non-commercial use only and cannot be used for funded projects or corporate research collaborations.
Tips for obtaining free quota
- Recommend others to register: Each time you successfully invite a user, both parties will receive an additional 300 credits.
- Daily login quota: 50/day for free tier, 100/day for paid tier (valid on the same day, no accumulation).
- New user registration: Receive 150 credits at a time.
Team/Enterprise Solution
Undisclosed pricing, known features:
- The credit limit is rollable (up to 20% of the unused limit can be carried forward to the next month).
- Management console: Administrators can uniformly allocate quotas and view usage statistics.
- Fees are contracted on an annual basis, and the discount ratio needs to be confirmed by the business.
Figure Labs application scenarios
Scenario 1: Chart production for life science papers
Task Type: Schematic diagram of molecular mechanism, signaling pathway diagram, immune cell interaction diagram, overview of experimental process.
Actual Benefits: Traditional methods (BioRender drag and drop or AI/PS manual drawing) take 2-6 hours per figure, Figure Labs compresses first draft generation to 3-10 minutes. More importantly, the generated results are directly output as editable SVG/PPTX, eliminating the time of repeatedly adjusting formats between multiple tools.
Deduction comparison:
- Traditional path: Idea → BioRender search icon (30min) → Drag and drop arrangement (1-2h) → Annotate text (30min) → Export → Import PPT adjustment (30min) → Total time taken ~3-4h.
- Figure Labs path: Enter description (5min) → AI generation (1min) → AI editing and correction (10min) → Export SVG/PPTX (2min) → Total time taken ~18min.
Scenario 2: Schematic diagram of experimental equipment in the field of engineering and physics
Task Type: Three-dimensional schematic diagram of the experimental device, system architecture block diagram, fluid/mechanical analysis diagram, and circuit schematic diagram.
Real Benefit: Biology-specific tools like BioRender cannot cover the engineering/physics world. Figure Labs' generative paths are not limited by subject presets. Diagrams such as mechanical structures, circuit layouts, and optical paths that could only be drawn with CAD or general drawing software in the past can now be quickly generated through text descriptions.
Deduction comparison:
- Traditional path: SolidWorks/Illustrator modeling or drawing (4-12h) → screenshot/export (30min) → annotation (1h) → total time consumption ~5-14h.
- Figure Labs path: describe the experimental device structure (10min) → AI generation (1min) → local correction Region Redraw (15min) → export 8K PNG/SVG (2min) → total time consumption ~28min.
Scenario 3: Computer Science/AI Model Architecture Visualization
Task type: Neural network architecture diagram, Transformer module schematic diagram, data processing Pipeline, model comparison diagram.
Actual benefits: The most common requirement in AI papers - drawing architecture diagrams. Traditionally, you need to use PowerPoint or Keynote to draw boxes, arrows, and connections layer by layer. When encountering complex diagrams such as attention mechanisms and multi-head structures, it is extremely error-prone and time-consuming.
Deduction comparison:
- Traditional path: PPT drawing layer by layer (2-6h) → manual alignment/color matching (1h) → export (10min) → total time consumption ~3-7h.
- Figure Labs path: Use natural language to describe modules and connection relationships (10min) → AI generation (1min) → Fine-tune color matching and layout (10min) → Export vectors (2min) → Total time taken ~23min.
Scenario 4: Rapid production of teaching and training materials
Task type: courseware illustrations, teaching wall charts, laboratory safety process instructions, and popular science visualization.
Actual Benefits: Teachers and professors lack the means to quickly generate high-quality scientific illustrations when creating courseware. Figure Labs allows you to generate teaching diagrams directly from course descriptions, with unified styles and adjustable vectors.
Scenario 5: Standardization of internal laboratory documents
Task type: Experimental plan SOP pictures, instrument operation guide, group meeting PPT materials, fund application diagram.
Actual benefits: Complete the process from generation to export (PPTX) in the same platform, ensuring the visual unity of internal documents in the laboratory and reducing the management cost of "ten people and ten painting styles".
Who is Figure Labs suitable for?
Suitable for the crowd
- Graduate students (Master/Ph.D.): The most frequent needs for writing papers, group reports, and posters—quickly generate publishable Figures. The learning cost of Figure Labs is almost zero (no need to learn BioRender, AI or PS), allowing students just entering the industry to produce consistent scientific research illustrations.
- Postdoctoral/Assistant Researcher: Tool for "guaranteing publication" under the pressure of high-frequency submissions. Every time you modify the "Figure is not clear enough" or "lacks schematic diagram" in the Reviewer's comments, AI's rapid generation and export of editable vector formats is the most direct value.
- PI/Professor: Review Figures within the group and prepare illustrations for fund applications. The PI does not need to operate the drawing software personally, but can describe the requirements and let AI generate a first draft, which can then be handed over to team members for fine-tuning.
- Research Drawing Manager (Lab Manager/Core Facilities Personnel): Responsible for illustration standardization and quality management for the entire laboratory or department. Figure Labs' template and export consistency significantly reduces the cost of managing a consistent style.
- Interdisciplinary collaborative team: The project involves multiple disciplines (such as bioinformatics, drug design, medical devices), and each discipline requires a different style of schematic diagram. Figure Labs eliminates the need to deploy separate drawing software for each discipline.
Human-machine collaboration boundary (based on Type D rules)
| Sectional | Degree of automation | Description |
|---|---|---|
| Concept/description input | 100% human (irreplaceable) | AI cannot replace researchers’ understanding and description of scientific concepts |
| First draft generation | 100% AI | This is the core value of Figure Labs - AI autonomously generates schematic diagrams |
| Scientific accuracy review | 100% human (cannot be skipped) | There may be details in the AI-generated diagrams that "look right but are actually wrong" and must be reviewed by subject experts |
| Local modification and adjustment | 70% AI + 30% human | Text Edit and Region Redraw lower the threshold for modification, but direction judgment still requires humans |
| Style/color fine-tuning | 50% AI + 50% human | AI provides style references and templates, but the final aesthetic choice lies with the researcher |
| Vector export and format adjustment | 100% AI | One-click export without manual intervention |
| Final verification before publication | 100% human (irreplaceable) | The last step before submission to the journal must be manual verification (including annotation accuracy, citation permission, etc.) |
Not suitable/not suitable for people
- Scenarios that require highly customized original visual design: If you are pursuing an "artistic" scientific cover image (such as a Cell/Nature/Science cover illustration), the first draft of Figure Labs may require a lot of manual intervention, so it is better to directly entrust a professional scientific illustrator.
- Requires 100% accurate diagrams to the atomic/molecular level: In scenarios that have strict stereochemical accuracy requirements for chemical structural formulas, crystal structures, protein 3D structures, etc., AI generation may introduce misleading visual simplifications. It is recommended to use professional tools (ChemDraw, PyMOL, VMD) to generate the basic structure, and then import it into Figure Labs to complete the overall layout.
- Batch/programmed generation requirements: Currently there is no API and cannot be embedded in the laboratory automation pipeline. Teams that need to produce large numbers of Figures in batches need to evaluate labor costs.
- Data visualization (statistical chart) scenario: Figure Labs does not do data processing and statistical charts (such as histograms, scatter plots, heat maps). Such requirements still require the use of tools such as GraphPad Prism, R ggplot2, and Python Matplotlib.
Summary and Outlook of Figure Labs
Core competitiveness
Figure Labs' positioning in the scientific research drawing track can be summarized by three "uniques":
- The only scientific research drawing tool that uses AI Agent to replace the entire "start from a blank canvas" process - not a template library, not an icon drag and drop, but an independent generation after understanding scientific concepts.
- The only AI scientific illustration platform that can output editable vector formats (SVG+PPTX) and pass the publishing standards of top journals - solving the core contradiction of "AI is easy to use but cannot be published".
- The only AI scientific mapping solution with cross-disciplinary (not just biology) coverage - researchers in engineering, physics, chemistry, and computer science are no longer constrained by the hidden ceiling of the biology library.
Current Limitations
- The Bounds of Scientific Accuracy: AI-generated scientific diagrams are essentially "best guesses" and may lead to misleading visual simplifications in rare structures, newly discovered molecular mechanisms, or highly specialized experimental designs. There is no substitute for final review by the PI.
- Usage anxiety caused by the credit quota system: Although the quota system is reasonably designed (generate 50 quota SVG and export 150 quota), high-frequency users (graduate students who need 10+ pictures per day) may also use up the quota in the third week under the Pro plan of 20,000/month. The transparency and early warning mechanism of quota consumption need to be strengthened.
- No API/No batch processing capability: For scenarios where Figure generation needs to be embedded into the laboratory data pipeline, there is currently no programmatic access solution.
- Dependency risk of model aggregation: The underlying model comes from a third party (OpenAI, Nano Banana, SeeDream, etc.). Fluctuations in service quality or policy changes (such as API outage, content policy tightening) of any model may directly affect the generation effect of Figure Labs.
Follow-up observation points
- Model update rhythm: Will new underlying models be continuously introduced? How transparent is the model switching (does the user know which model they are using)?
- Completeness of collaboration functions: Does it support real-time collaborative documents (such as Google Docs-style multi-person online editing of Figures)?
- API Open Plan: Will the REST API be opened in 2026-2027 so that laboratories can call it programmatically?
- Discipline Vertical Deepening: Will vertically optimized versions be launched for specific disciplines (such as medicinal chemistry, neuroscience)?
Procurement/Adoption Risk Assessment
- Individual Researcher: Starting with Free is the low-risk path - an initial credit of 200 is enough to generate 3-4 first drafts to assess quality. If the daily frequency is low (5-10 pictures per month), the Starter plan ($10/month) is the most cost-effective entry plan.
- Lab/Research Group: It is recommended to pilot the Pro plan ($54/month) in a research group for one month to evaluate the ability to produce quality coverage of this subject area. Core concerns: ① Whether AI can accurately understand the unique scientific concepts and annotation habits in this field; ② Whether the exported vector format can be seamlessly integrated into the laboratory's existing paper writing process (Overleaf/Word/PPT); ③ Whether team members are willing to migrate from BioRender or other tools.
- Institution/department level procurement: ① Must obtain enterprise solution pricing and sign a DPA (data processing agreement) - although Figure Labs promises not to use user data to train models, institutional legal affairs should conduct a data protection compliance review according to regulations such as GDPR/CCPA; ② Confirm that the commercial authorization terms cover the scope of use for teaching purposes and third-party cooperation projects; ③ Assess the risk of vendor lock-in - if all Figures generated are in SVG Format export and save, you can losslessly migrate to other vector editing tools without renewing the contract.
Related tools:  Midjourney, stable-diffusion
Version Info
- current :Current version.
- launch :Product goes online.
User Reviews