 Bricks
Free
Bricks
Free
Bricks is an AI tool product for business and content teams, suitable for quickly verifying generation capabilities and collaboration efficiency in real tasks.
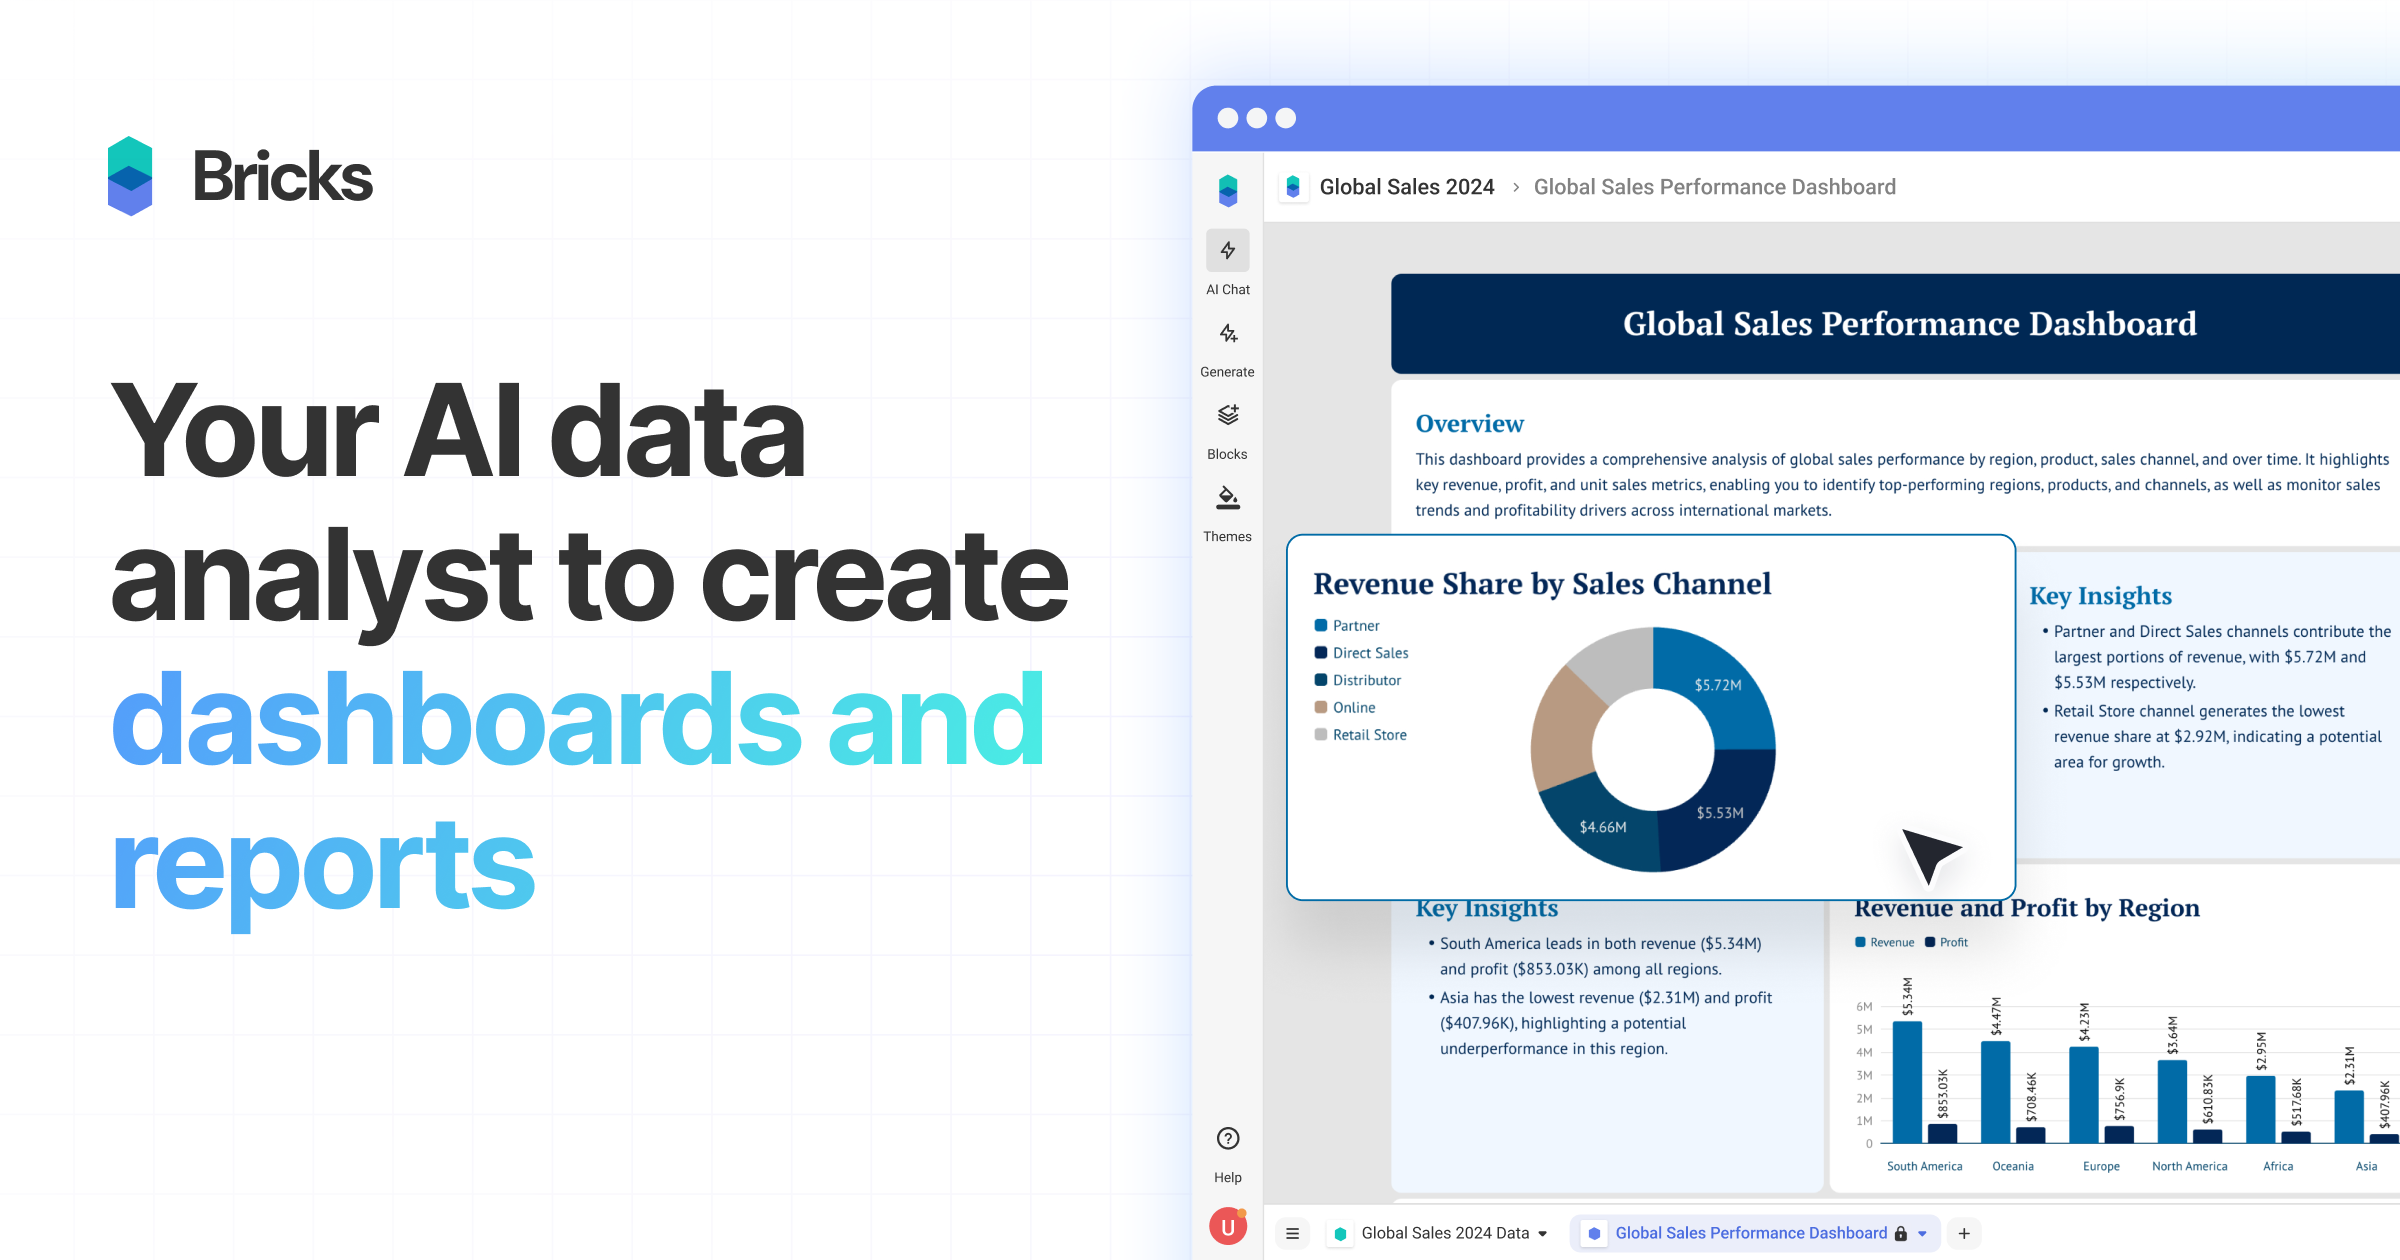
Bricks
Core parameters and statistics of Bricks
Bricks is an AI data dashboard and reporting platform for non-technical users, positioned between the ease of use of Canva and the depth of analysis of Tableau - officially called the "Goldilocks solution". It does not pursue the replacement of enterprise-level BI tools, but focuses on covering the high-frequency scenario of "daily CSV/Excel data → visual dashboard".
| Projects | Public Information |
|---|---|
| Product Positioning | AI Data Dashboard and Reporting Platform (Goldilocks Solution) |
| Product form | Web online service (SaaS) |
| Target users | Business people, operations, analysts, managers, no technical or design background required |
| Input format | CSV, XLSX, PDF, PNG (image table) |
| Output format | PDF, PPTX, secure sharing link Demo within Bricks |
| Chart types | Bar chart, line chart, pie chart, scatter chart, table KPI, organizational chart, US geographical map, heat map, tree map, Sankey chart, funnel chart, combination chart, donut chart, vertical/horizontal chart, etc. |
| Team size support | Free version ≤3 people, Premium version ≤200 people, Enterprise version ≥200+ |
| Data security | Transmission and storage encryption, data is not used for AI training |
| Number of users | Officially said 100,000+ professionals are using |
| Well-known clients | PwC, Cambridge, Deloitte, NVIDIA, ByteDance, Adobe, Accenture, MIT |
| Latest version | Web Rolling Release (~2026-06) |
| Platform Support | Web |
Parameter Interpretation: The core delivery unit of Bricks is the "dashboard" rather than a single chart - after uploading the file, AI automatically generates an interactive dashboard containing multi-chart KPIs and text analysis. This delivery model of "AI completes 80% and manual fine-tuning 20%" determines its applicable boundaries: scenarios where the data is within a few thousand rows and does not require complex database association are most efficient. For scenarios that require real-time database connections, custom SQL, or large data volumes (millions of rows), Bricks is not a substitute. Its design philosophy is to "compress 99% of daily data work from hours to minutes."
AI Messages Quota Mechanism: Bricks's free quota is counted in "AI messages" - one is consumed every time an AI operation such as generating dashboards, editing charts, and analyzing data is initiated. When the quota is exhausted, AI functionality is suspended, but manual editing, exporting, and sharing continue to be available. This is a differentiated design that is different from traditional SaaS "complete lock-in".
Users and market recognition of Bricks
Bricks' user base shows a trend of "C-port reputation drives B-end multi-industry penetration", but the official has not disclosed the precise number of paying users and enterprise-level revenue data. The following analysis is based on the public information and verifiable signals on the official website.
User Scale: The statistical algorithm at the top of the official website shows 100,000+ professionals trust Bricks. Combined with its Free plan being completely free for teams of 3 or less, this number includes a large number of free users, but also illustrates that the product has moved beyond the early cold launch stage. The user portraits are inferred from the official website testimonial and cover diverse roles such as vice presidents of financial institutions, general managers of non-profit organizations, CEOs of media companies, e-commerce CFOs, university professors, and doctoral students, indicating the cross-functional appeal of the product.
Brand Endorsement: The official website prominently displays the logos of PwC, Cambridge, Deloitte, NVIDIA, ByteDance, Adobe, Accenture, MIT and other institutions. These brands generally do not arbitrarily authorize logo display, which reflects that Bricks has received formal adoption or pilot verification in at least some organizations. However, it should be noted that the logo wall only indicates a partnership or usage record, and does not directly represent large-scale enterprise-level deployment.
Industry Coverage: The official website lists 9 industry pages separately - financial services, education, healthcare, government, retail, manufacturing and supply chain, real estate, technology, and construction. Each industry page is equipped with a customized scenario description, indicating that Bricks' product positioning is industry-specific rather than a general-purpose BI tool. Because Bricks focuses on CSV/Excel data, it is most efficient in industries such as finance (report automation), retail (sales dashboards), and education (teaching data analysis).
Competitive alternative landscape: The official website provides 6 direct comparison pages - vs Tableau, vs Power BI, vs Looker, vs Excel Dashboards, vs Google Sheets Dashboards, vs Canva for Data Visualization. This shows that Bricks’ definition of competitive products is not a category, but a variety of alternatives to existing workflows. Its core arguments are: Excel dashboards are too time-consuming, Canva cannot handle multi-chart data, and Tableau/Power BI is too complex for most users. This "three-sided attack" positioning strategy effectively lowers the user's decision-making threshold.
Bricks Cost Advantage
Bricks' cost structure uses "AI message" as the core billing unit, and cooperates with seat-based subscriptions to form tiered pricing. The following starts from three levels: C-side/individual, team/enterprise, and hidden costs.
C-side/individual: zero threshold but strict frequency limit
The Free plan is completely free and includes 20 AI messages/month, AI dashboard and report generation, AI data visualization and analysis, and AI conversational data query. For individual users, 20 items/month is enough to complete 3-5 complete dashboard creation and iterations. AI functionality is suspended after quota is exceeded, but manual editing is not affected. For personal analysis scenarios where the monthly data reporting frequency is 1-2 times, the Free plan may be sufficient for the long term.
Team/Enterprise: Message quotas and seat-driven tiered pricing
| Plans | Price (pay monthly) | Price (pay annually, save 30%) | AI message quotas | Team size | Core differences |
|---|---|---|---|---|---|
| Free | $0/user/month | — | 20 AI messages/month | ≤3 people | AI dashboards, charts, analytics, data conversations |
| Premium | $25/user/month | $17.5/user/month ($210/year) | 200 AI messages/month | ≤200 people | PDF/PPTX/XLSX/HTML export, spreadsheet/kanban/document core tools |
| Pro | $100/user/month | $70/user/month ($840/year) | Unlimited | ≤10 people | Advanced connector Tableau/Power BI export, embeddable dashboard, unlimited length PDF import, unlimited brand theme AI quick layout |
| Enterprise | Business pricing | Business pricing | Unlimited | 200+ people | Priority support, large teams, advanced needs and scale customization |
Design logic for price: Free is suitable for personal early adopters and PoC; Premium is the main solution for most business teams, with 200 AI messages/month corresponding to about 50 AI operations per week, which can support high-frequency dashboard iterations; Pro's "unlimited AI messages" and "Tableau/Power BI export" indicate that its target users are heavy analysis users and BI tool migraters; Enterprise is for large-scale deployment, but the price needs to be confirmed by business.
Hidden cost and ROI deduction (Rule D mandatory: quantification of cost reduction and efficiency improvement)
The following deduction is based on public information and average usage patterns of similar tools, unofficial commitment data:
- Operators produce weekly report dashboard: The traditional method (Excel manual drawing + typesetting) takes about 2-4 hours/week, using Bricks to upload CSV→AI generation→manual fine-tuning takes about 10-20 minutes, compressed from 2-4 hours to 15 minutes, a reduction of about 85-95%. Based on an annual salary of 300,000 operating personnel, a single person and single scenario can save about 40,000-60,000 yuan per year.
- Monthly report for financial staff: from manual sorting of multiple sheets to automatic generation of trend charts + KPI dashboards after uploading, compressed from 1-2 days to 30-60 minutes, with higher consistency and fewer human errors.
- Manager self-service analysis: Business managers do not need to request the data analysis team to produce graphs every time. They can directly upload CSV to obtain visualization and insights. From "scheduling for 2-3 days" to "immediate self-service", it indirectly reduces the temporary demand response burden of the data team.
Security and Compliance (Rule D Mandatory: Human-Machine Collaboration Boundary)
Bricks' data security statement is clear: user data is fully encrypted (transmission and storage) and "will never be used for AI model training." This commitment is one of the strongest privacy protection statements among similar AI data analysis tools. However, for strictly regulated industries (finance, medical, government affairs), you still need to pay attention to:
- 100% automation: AI dashboard generation after data upload, automatic matching of chart types, automatic calculation of KPIs, and trend line fitting.
- Manual confirmation points (Human-in-the-loop) must be set: sharing permission settings related to data privacy, sharing scope of exported files containing sensitive data, and digital verification of key business indicators (AI-generated insights need to be manually confirmed for rationality before being used for formal reporting).
Main features of Bricks
Bricks' function matrix is designed around the full link "from raw data to deliverable dashboards" rather than a stack of isolated function points. The following are arranged by usage flow.
-
AI dashboard one-click generation: After uploading CSV/XLSX/PDF/PNG, AI automatically generates an interactive dashboard containing multi-chart KPIs, data tables and text analysis within 30-60 seconds. This is Bricks' most differentiated core capability - competing products either require manual orchestration (traditional BI) or only support single chart generation (most AI charting tools). AI will automatically identify the data type and select the most appropriate visualization method (time series → line chart, classification comparison → bar chart, proportion → pie chart/tangible chart), and at the same time output an analysis summary to illustrate key trends.
Hidden linkage: Interactive filtering is supported between charts in the same dashboard - click on any data point, and the entire dashboard will be linked to filter, achieving cross-chart analysis of "click on a KPI card → all associated charts will focus simultaneously", which is a synergistic effect that ordinary AI chart tools do not have.
-
AI chart and graph generation: Supports natural language description to create charts ("Plot a histogram of sales by region and mark the comparison with the same period last year"), and also supports adding new visual elements from existing dashboards. After the chart is generated, it supports AI fine-tuning ("change to donut chart") or manual drag and drop adjustment.
Hidden linkage: Charts not only display data, but also provide embedded AI analysis - each chart is accompanied by text insights ("Q2 sales increased by 23% year-on-year, mainly contributed by North District"), combining "graph making" and "graph reading" into one, saving the time of writing additional analysis reports.
-
AI Reporting and Export: Supports exporting dashboards to PDF (suitable for formal reporting) and PPTX (suitable for further editing), as well as generating secure sharing links and full-screen presentations directly within Bricks. Premium supports XLSX and HTML export, and Pro additionally supports Tableau/Power BI export (for handing over Bricks exploration results to the enterprise BI pipeline).
Hidden linkage: The "Data to Slides" function directly converts the dashboard into a presentation. Each chart is automatically assigned to an independent slide and equipped with a title, which solves the cross-software switching pain point of "having to manually paste the graphics to PPT after making the dashboard".
-
AI Spreadsheet: Bricks has an embedded AI-enhanced spreadsheet that supports core spreadsheet functions and can also manipulate data through natural language ("Format this column as a percentage and retain two decimal places", "Calculate the average customer unit price in each region"). After data changes, the associated dashboard automatically refreshes.
Hidden linkage: Two-way binding between the spreadsheet and the dashboard - the dashboard chart is automatically updated after modifying the table data, without the need for a secondary operation of "re-upload → re-generate". This linkage means that Bricks is not just a "dashboard builder", but more like a lightweight "data workbench".
-
Template System: You can save the created dashboard as a template and reuse the layout with one click when uploading new data later. This significantly improves the efficiency of periodic reporting (monthly sales reports, weekly operation dashboards) - only the underlying data needs to be updated, and the dashboard structure, theme, and brand color matching are automatically inherited.
-
Real-time collaboration and version history: Supports real-time editing, commenting and permission management for teams. All changes automatically save version history, and any historical state can be traced back and restored. The Free version supports collaboration with up to 3 people, and the Premium version supports a team of up to 200 people.
-
Professional Theme and White Label: Provides professional design themes with one-click application. The Pro version unlocks unlimited brand themes and is suitable for external customer delivery scenarios. The theme covers a full set of visual specifications such as color matching, fonts, layout, etc., solving the problem of "looking good but not being able to make it".
Version evolution of Bricks
Bricks is mainly a SaaS online service. The official does not use semantic version numbers (such as v1.2.3) for public release. Instead, it updates product capabilities through a continuous delivery (Rolling Release) mechanism. The following version history is based on official publicly accessible milestones.
Current Mainline (Rolling Release ~2026-Q2)
- Web Rolling Release (~2026-06): The latest status of the current online service. The official rolling update of product functions, chart type AI model capabilities and collaboration functions is done through continuous delivery. There is currently no fixed semantic version number and precise release date. In terms of product management, users do not need to manually upgrade, and new functions are pushed in grayscale on the server side by default.
Historical nodes
- Public Launch (~2024-01): Historical milestones recorded by publicly accessible phase. Bricks is officially open to the public, initially establishing the core capability of "one-click generation of AI dashboards", supporting CSV/Excel upload and basic chart generation, and supporting two-level pricing, Free and Premium.
Summary of version features
| Dimensions | Bricks versioning strategy |
|---|---|
| Version number | No public semantic version number, using Rolling Release |
| Update granularity | Continuous/grayscale push, functions are launched independently by module |
| User perception | New features are gradually opened within the application, and there are no forced upgrade pop-ups |
| Fallback mechanism | Relies on SaaS server version management, no user-side rollback entry |
| Release Notes | The official documentation site (thebricks.com/docs) and blog (resources) are kept updated |
The advantage of SaaS rolling updates is that users always use the latest features and do not need to care about version numbers. The price is: when there are major changes to the AI model or chart engine, the saved dashboard layout may need to be manually adapted - the official has not yet released a detailed version compatibility statement.
Technical Advantages of Bricks
Bricks' technical route is in sharp contrast to traditional BI tools such as Tableau/Power BI, and its design philosophy can be summarized as the "AI-first 80/20 principle."
AI automatic data understanding and visual mapping: After uploading data, Bricks' AI layer performs data pattern recognition - determining column types (numeric, categorical, date, geography), detecting data distribution and correlation, and automatically selecting the optimal visual encoding. For example, a table with two columns: "Date" and "Sales" will automatically generate a time series line chart + monthly KPI card + year-on-year analysis. The engineering difficulties in this process are: data column names may be ambiguous, missing value processing, outlier detection - the implementation strength of Bricks determines the usability of the dashboard under low-quality data. Officially, it takes "30-60 seconds to generate the dashboard". In actual experience, the higher the data quality, the higher the accuracy of the AI output.
Natural Language Interface (NL Interface): Bricks encapsulates AI interaction into two layers: the first layer is a zero-threshold entry for "one upload → complete dashboard"; the second layer is conversational fine-tuning ("Add a stacked bar chart by product category" "Change the color to the company brand color"). This design reduces reliance on SQL or formula knowledge, but at the cost: for advanced users who need to precisely define calculation logic or data transformation, the ambiguity of natural language may lead to repeated tuning, which is not as efficient as directly writing formulas.
Real-time linkage engine: Interactive filtering between charts in the dashboard requires an underlying data status synchronization mechanism. The implementation of Bricks is: all charts share the same data context (similar to Power BI's "filter" concept), click on a data point in any chart, and the filter conditions are broadcast to all associated charts, triggering real-time updates. The advantage of this architecture is that users get immediate response. The disadvantage is that in large data volumes (>10,000 rows) or multi-dimensional analysis scenarios, the computational overhead of status changes may cause lags.
AI message points mechanism: Bricks uses "AI messages" instead of traditional API Tokens or request times to measure AI usage, which reduces the understanding cost for non-technical users. Each AI message corresponds to an AI generation or editing operation, and the points quota is reset monthly. From an engineering perspective, this billing model requires the backend to perform accurate quota deduction and status synchronization for each AI call, while ensuring that the experience degradation of free users after the quota is exhausted (AI functions are suspended but manual editing continues) will not affect retention.
Data Security Architecture: The official statement clearly states that data encryption (transmission TLS + storage encryption) is not used for AI training. This means that Bricks’ AI model does not use user uploaded data as a model training signal when generating dashboards and analyses. This is a strong commitment to privacy protection among AI data analysis tools, but it also means that the model’s understanding of user-specific domain knowledge can only rely on context windows and cannot adapt to industry terms through fine-tuning.
How to use Bricks
Bricks has an extremely short path to entry, which is one of its core product strengths. The following is a summary of typical usage paths based on different roles.
| How to use | Suitable for the role | Prerequisites | Typical process | Cost |
|---|---|---|---|---|
| Web online version | All users | Visit app.thebricks.com to register an account | Upload data → AI automatically generates dashboard → AI fine-tuning or manual drag and drop adjustment → Export/share | Free version $0, Premium $17.5-25/user/month |
| Pro Professional Edition | Heavy analysis user BI migration | Team seat purchase required | Same as above + Use advanced connectors, embed dashboards into internal systems Tableau/Power BI export integration | $70-100/user/month |
| Enterprise Edition | Large-scale organization | Business negotiation required | Same as above + SSO, customized themes, priority support, large team management | Business pricing |
Typical steps to get started (taking the Free version as an example):
- Registration and data preparation: Visit app.thebricks.com/sign-up and register with your Google account or email. Prepare the CSV or Excel file (it is recommended to do basic cleaning first: standardize column names, handle null values, and unify the format).
- Upload and generate dashboard: Click "Create Dashboard" on the dashboard page and select the data file to upload. Wait 30-60 seconds for AI to automatically complete data analysis and visual mapping.
- AI fine-tuning: Use natural language to make modification requests, such as "Change the main chart to a donut chart", "Add a large number KPI showing total sales in the upper right corner", "Add a trend line to the line chart". Each modification consumes one AI message.
- Manual fine-tuning: If you are not satisfied with the AI output, use the drag-and-drop editor to manually adjust the chart position, size, color, and font. This step does not consume AI messages.
- Apply theme and brand color: Select or customize a brand theme from the theme library and apply it to the entire dashboard with one click.
- Export and Share: Export via PDF/PPTX for offline reporting, or generate a public/encrypted sharing link for online viewing. It also supports full-screen mode for direct presentation in meetings.
Implementation Notes: The value of Bricks is maximized in the "first dashboard generation" section - subsequent update and maintenance cycles depend on the frequency of data changes. If it is a weekly/monthly report scenario, you can use the template function to save the layout, and next time you only need to replace the data source to refresh it with one click. If the data source comes from connectable data sources such as Google Sheets, Premium and above plans support direct connection, reducing manual upload steps.
Bricks Product Pricing
Bricks' pricing is based on the dual axes of "message quota × user seats", and covers the entire spectrum from individuals to enterprises in conjunction with functional grading. The following is compiled based on the public information on the official website pricing page in June 2026.
Plan level comparison
| Plans | Free | Premium | Pro | Enterprise |
|---|---|---|---|---|
| Monthly Price | $0/user/month | $25/user/month | $100/user/month | Business Pricing |
| Annual payment price (equivalent to monthly payment) | — | $17.5/user/month | $70/user/month | Business pricing |
| AI message quota | 20/month | 200/month | No limit | No limit |
| Maximum team size | 3 people | 200 people | 10 people | 200+ people |
| AI Dashboard/Report | ✅ | ✅ | ✅ | ✅ |
| AI Data Visualization | ✅ | ✅ | ✅ | ✅ |
| AI Data Analysis | ✅ | ✅ | ✅ | ✅ |
| AI Data Dialogue | ✅ | ✅ | ✅ | ✅ |
| PDF/PPTX Export | — | ✅ | ✅ | ✅ |
| XLSX/HTML Export | — | ✅ | ✅ | ✅ |
| Spreadsheet/Kanban/Document Tools | — | ✅ | ✅ | ✅ |
| Advanced Connector | — | — | ✅ | ✅ |
| Tableau/Power BI Export | — | — | ✅ | ✅ |
| Embeddable Dashboard | — | — | ✅ | ✅ |
| Unlimited length PDF import | — | — | ✅ | ✅ |
| No limit to brand themes | — | — | ✅ | ✅ |
| AI Quick Layout Export | — | — | ✅ | ✅ |
| Priority Support | — | — | ✅ | ✅ |
| SSO/Advanced Security | — | — | — | Business Confirmation |
| Customized Contract/SLA | — | — | — | Business Confirmation |
Pricing Strategy Analysis: The Free version is positioned as a "product experience bait" rather than a "real usable productivity solution" - the quota of 20 AI messages can complete the creation of 3-5 dashboards, but is not enough to continuously serve the monthly reporting cycle. Premium is the main revenue plan, and the quota design of 200 items/month corresponds to the high-frequency usage model of "50 AI operations per week". Pro's "unlimited AI messages" is a key funnel - for users who consume a lot of AI messages, the marginal cost after upgrading from Premium to Pro is zero, and it is easy to form payment inertia. The price of Enterprise is not disclosed, and the functional differences are mainly concentrated in the management and security layers (SSO, SLA, auditing), indicating that Bricks' key revenue market is small and medium-sized enterprises rather than large enterprises.
Annual vs Monthly: Annual payment enjoys a 30% discount, which is an effective means to boost prepayment cash flow and reduce churn rate. For teams that plan to use it for more than 6 months, the cost-effectiveness of annual payment is obvious.
Application scenarios of Bricks
Bricks' scenario coverage is based on the dimension of "department function × data form". The following are typical scenarios arranged from high frequency to low frequency.
-
Sales Dashboard and Performance Tracking: The sales team can upload the CSV data (opportunity funnel, regional sales, product line performance) exported from the CRM, and AI will automatically generate a comprehensive dashboard including total sales KPIs, regional histograms, monthly trend line charts, and product structure pie charts. Benefit: From the half-day work of "sales manager manually summarizing Excel → PPT" to 15 minutes of "uploading data → AI generation → fine-tuning → sharing". Verification focus: The accuracy of AI’s semantic understanding of the column names (such as opp_value, close_date, stage) exported by CRM directly affects the quality of the chart.
-
Marketing Report and Event Analysis: The marketing team can combine multi-channel delivery data, social media analysis, and event registration data into one dashboard, and AI can automatically identify key indicators such as return on investment, single customer acquisition cost, and conversion rate. Revenue: The data analysis cycle after advertising is shortened from 1-2 days to immediate, making it easier to quickly adjust the next round of advertising strategy. Key points to verify: When merging multi-source data, is AI's consistency in field mapping (for example, "date" may be called "Date", "time", and "create_time" in different tables) reliable?
-
Financial Summary and Budget Tracking: Finance personnel upload monthly financial statements (profit and loss statement, cash flow statement), and AI automatically generates trend charts, year-on-year comparison analysis and abnormal value annotations. Benefits: The monthly financial report preparation time is reduced from 1-2 days to 30-60 minutes, and financial personnel can focus more on "analyzing the causes of exceptions" rather than "making diagrams and formatting". Human-machine collaboration boundary (mandated by Rule D): Financial numbers and trend analysis automatically generated by AI must be manually verified before being used for formal reporting - the risk of numerical calculation errors or contextual understanding bias is much higher in financial scenarios than in marketing scenarios.
-
HR Human Data Dashboard: The HR team uploads CSVs such as personnel turnover tables, recruitment funnel data, training participation rates, etc., and AI generates a dashboard including turnover rate trends, department personnel distribution, and recruitment conversion funnels. Benefits: From the "fire alarm mode" where HR makes temporary diagrams when reporting to management, to a self-service dashboard that is updated daily. Key points for verification: The calculation caliber (definition, numerator and denominator) of sensitive indicators such as turnover rate needs to be checked with the AI output.
-
Operation indicator monitoring: The operation team uploads daily/weekly business indicators (order volume, customer complaint rate, delivery timeliness), and AI automatically generates KPI cards and trend charts, and marks abnormal fluctuations. Benefits: From "the operations specialist manually pulls data to make tables every morning" to "opening the dashboard and seeing the latest status", about 3-5 man-hours are saved every week. Human-machine collaboration boundary: "Exceptions" marked by AI should be regarded as prompts rather than conclusions - operators need to judge whether upgrade processing is needed based on actual business conditions.
Bricks is suitable for people
Bricks' "zero-threshold" positioning makes it accessible to a wide range of non-technical users, but the depth of use and value capture methods of different roles vary significantly.
-
Business Operations and Data Personnel: This is the core target group of Bricks. They process CSV/Excel data on a daily basis and need to make regular reports, but lack SQL/BI tool skills. The value of Bricks is to help them liberate themselves from "manual diagram layout" and invest in data interpretation and business recommendations. Typical Adaptability: High - As long as the data is a formatted table that is used daily, it can almost 100% replace the traditional "Excel drawing → pasting into PPT" workflow. Not suitable for boundaries: When complex cleaning, correlation query or multi-dimensional analysis of data is required, Bricks' AI and built-in spreadsheet capabilities are limited, and it is recommended to use it with Python/BI tools.
-
Managers and decision-makers: Enterprise middle managers (VP of department directors) often need to quickly obtain an overview of data but cannot rely on the data analysis team to respond in a timely manner. Bricks’ self-service dashboard generation allowed them to get a visual overview directly from the raw data. Typical Adaptability: Medium to High - The value comes from "improved timeliness" rather than "depth of analysis", suitable for management roles that need to check trend changes frequently. Not Fit Boundary: For requirements that require advanced analytics such as fine-grained drilldown, anomaly root cause analysis, predictive modeling, etc., Bricks does not currently support such capabilities.
-
Marketing and Sales Team: This role typically uses data exported from CRM and marketing platforms for regular reporting. Bricks can quickly transform raw data into client-visible summary reports or internal strategy dashboards. Typical Adaptability: High - Scenarios such as sales funnels, marketing channel attribution, and customer stratification are Bricks pre-designed use cases, and AI can better identify relevant indicators. Not fitting boundaries: If the data source is not a CSV/Excel export (such as pulling directly from Salesforce/Google Ads API), you need to manually export or connect first - the Premium version of the advanced connector can partially alleviate this problem.
-
Startups and small and medium-sized enterprises: Annual payment of $210/user (Premium) compared to Tableau Creator’s price of about $75/user/month. Bricks’ feature set focuses more on “quick graph production” rather than “large-scale data management”. For startup teams that have data visualization needs but don’t want to hire data analysts, Bricks is a higher ROI option. Typical fit: High - small team, flexible process, high requirements for beautiful dashboards. Does not fit the boundary: Bricks may not be enough for scenarios that require embedding customer-facing real-time analytics products, require self-service data preparation (ETL), or require OAuth/SSO enterprise-level integration.
Not suitable for the crowd and scene
- Data Engineers and Analysts: In self-service analysis scenarios that require SQL queries, direct database connections, and millions of row-level data processing, Bricks is more suitable as a supplement to "quick graph production" rather than as the main tool.
- Large Enterprise Data Teams: Organizational-level BI needs to be built on top of a unified data lake/data warehouse, and Bricks' CSV/Excel granular input is not suitable as an enterprise-level analytics infrastructure.
- Industries that require strict auditing and compliance (financial transactions, medical records, government secrets): Bricks' data encryption ensures basic security, but the official has not disclosed SOC2, HIPAA and other compliance certifications, and needs to be confirmed before purchasing.
- Organizations requiring offline/privatized deployment: Bricks currently only provides SaaS web services and has no public privatized deployment plan. It is not suitable for scenarios with mandatory requirements for data sovereignty.
Summary and Outlook
Bricks' core competency lies in "liberating AI data analysis from technical barriers" - it does not require users to understand SQL, data models or visual design principles, and only needs to upload files to obtain professional-grade dashboards. This has found a clear differentiated positioning in the market gap where traditional BI tools are too complex, Canva cannot handle data and Excel is too time-consuming.
Core Competencies: The quality of the dashboard automatically generated by AI is at the leading level among similar tools - not just "generating charts", but outputting a deliverable work that includes multi-chart linkage KPIs and text analysis. The product philosophy of "AI completes 80% and manual fine-tuning 20%" lowers the starting threshold for data analysis.
Current limitations: Data input only supports file upload (up to thousands of lines of CSV/Excel/PDF), and cannot be directly connected to the database or API; AI has limited processing capabilities for complex column names and non-standard data formats; advanced analysis (predictive modeling, statistical testing) is not within the product scope; privatized deployment is not provided; there is no public SOC2/HIPAA and other compliance certifications.
Competition: Bricks faces three types of competing products: low-priced Canva Data and Google Looker Studio (free or low-priced), similarly priced AI dashboard tools (such as Rows AI, Numerous.ai), and high-priced Tableau/Power BI entry version. The advantage of Bricks lies in the combination of AI generation quality + design aesthetic, while the disadvantage lies in the depth of data source connection and performance when the amount of data is large.
Procurement and Adoption Risk Assessment (Recommendations are concentrated at the end of the summary): Bricks is suitable as a "department-level data visualization pilot tool" and is first verified with the Free plan - select 1-2 high-frequency data reporting processes (such as weekly reports, monthly reports), and evaluate the AI dashboard generation quality, team acceptance, and actual time-consuming reduction within 2-4 weeks. After passing the verification, upgrade to the Premium or Pro plan for expansion. Before purchasing, enterprises need to focus on confirming: the matching between the AI message quota and actual usage (to avoid affecting key reports after monthly excess), data security terms (especially the written commitment that "data will not be used for AI training"), and the coverage of key compliance requirements (such as SOC2, data residence location). For organizations with private deployment needs, Bricks is not currently an appropriate option.
Related tools:  Notion AI, google-workspace
Bricks’ model and version evolution
Continuous iterative updates, the latest version introduces performance optimization and new features. Historical version information can be viewed through the official release page. There is currently no complete public version evolution timeline.
How to use Bricks
- Web client: You can use it by visiting the official website and registering an account. Most functions do not require installation.
- API access: Provides RESTful API, developers can obtain the API Key and integrate it into their own applications.
Version Info
- Bricks Web Rolling Release :Officially, the online service is updated through continuous delivery. There is no official precise semantic version number and release date yet.
- Bricks Public Launch :There is no official precise date yet, but historical milestones are recorded according to the publicly accessible stage.
User Reviews